Preface
Contents
Preface#
The network machine learning earthquake#
In the early 1990s, a young Computer Science PhD student at Stanford University began thinking about themes for his doctoral thesis, a work which summarizes one’s contributions as a PhD student and contextualizes the research output produced during one’s tenure. Page had recently become enamored by the internet, and decided to focus on the interconnectedness of the world wide web, which has since become the backbone of the modern internet.
With the assistance of a fellow colleague, Sergey Brin, Page determined that the complicated set of links between documents on the world wide web could best be understood as a large network, in which the objects on the world wide web (documents) were interconnected through a series of links. These links were simply computer items which allow one to “jump” from one document to the next in a sequential fashion. The number of documents which linked to a reference document, Page and Brin theorized, gave some notion of the “popularity”, or the page rank of the document. Being out-of-the-box thinkers, Page and Brin took this idea and combined it with many other strategies: in particular, they developed a query system which allowed a sentence to be parsed into keywords, and then they developed an indexing system which mapped these keywords to the pages with the highest pagerank. After publishing several papers and getting a number of other computer scientists involved in the project, Page and Brin developed a prototype of the Google search Engine in 1998, and shortly thereafter, founded Google Inc. From there, the rest is history.
Fast forward over two decades, and networks have become a dominant data structure with which to understand many of the concepts of every day life. Social networks have led to a new rise in the interconnectedness of people, led by massive multi-billion dollar corporations such as Facebook, Twitter, Linkedin, Instagram, Douyin (TikTok), and WeChat. The economy forms a global interconnected trade network, wherein companies and countries interact with one another for daily commercial benefits. The Earth’s food chain forms an ecological network, in which plants and animals fight for survival in an unforgiving world. Neurons of the brain form an interconnected web of axons and synapses, together producing unique aspects about what make you really you.
Network Machine learning in your projects#
Recent developments in network science have produced new strategies with which you can hope to understand and derive insights from this pervasive way to understand the world.
Perhaps you’re a researcher and you want to expose shadowy financial networks and corporate fraud? Or create a network framework for measuring teamwork in healthcare? Maybe you’re interested in ecological releationships between different animals, or maybe you want to model communities of neurons in the brain?
Or maybe you’re a data scientist and your company has tons of data (user logs, financial data, production data, machine sensor data, hotline stats, HR reports, etc.), and more than likely you could view the data as a network and unearth some hidden gems of knowledge if you just knew where to look? For example:
Using customers and items as the nodes of a network, purchases as the edges between a customer and an item, and the number of purchases as edge-weights, you can explore the purchasing habits of the most active customers in a purchasing network.
With the nodes as employees and the edges as whether a pair of employees have worked on a project together, you can explore patterns of collaboration within your company.
With the nodes as purchasing and selling entities, such as customers or distributors, the edges as purchases between pairs of entities, and the edges as the size of a purchase, you can detect anomalous transactions to detect corporate fraud.
With the nodes as members of the supply chain, such as mining and transportation companies, and the edges as the paths through which production flows, you can develop transportation infrastructure to determine how to optimally disseminate production.
With the nodes as employees, edges as team co-assignment between employees, and node covariates as employee performance, you can isolate groups within your company which are over or underperforming employee expectations.
With the nodes as regions of the brain, the edges as whether two regions of the brain communicate, and network-level covariates as to whether or not each brain represents an individual with a mental health disorder, you can determine subsets of nodes which are most impacted by psychiatric illness.
…And many more!
Whatever the reason, you have decided to explore and exploit networks and implement their analysis in your projects. Great idea!
Objective and approach#
This book assumes you know next to nothing about how you can explore and exploit network data. Its goal is to give you the concepts, the intuitions, and the tools you need to actually implement programs capable of learning from network data.
The book is intended to give you the best introduction you can possibly get to explore and exploit network data. You might be a graduate student, doing research on biochemical networks or trade networks in ancient Mesopotamia. Or you might be a professional interested in an introduction to the field of network machine learning, because you think it might be useful for your company. Whoever you are, we think you’ll find a lot of things that are useful and interesting in this book!
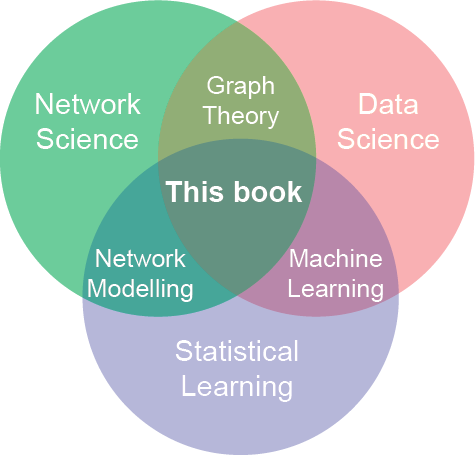
Fig. 2 Broadly, we think that the techniques developed and described in this book fall somewhere in the middle of this Venn Diagram. You will learn how to incorporate techniques from statistical learning and data science with network data.#
We’ll cover the fundamentals of network machine learning, focusing on developing intuition on networks, doing so while paired with relevant Python tutorials. By the end of this book, you will be able to utilize efficient and easy-to-use tools available for performing analyses on networks. You will also have a whole new range of techniques in your toolbox, such as representations, theory, and algorithms for networks.
We’ll spend this book learning about network algorithms by showing how they’re implemented in production-ready Python frameworks:
numpyandscipyare used for scientific programming. They give you access to array objects, which are the main way we’ll represent networks computationally.sklearnis very easy-to-use, yet it implements many machine learning algorithms efficiently, so it makes a great entry point for downstream analysis of networks.graspologicis an open-source Python package developed by Microsoft and the NeuroData lab at Johns Hopkins University which gives you utilities and algorithms for doing analyses on network-valued data.
The book favors a hands-on approach, growing an intuitive understanding of networks through concrete working examples and a bit of theory. While you can read this book without picking up your laptop, we highly recommend you experiment with the code examples available online as Jupyter notebooks at http://docs.neurodata.io/graph-stats-book/index.html.
Prerequisites#
We assume you have a basic knowledge of mathematics. Because network science uses a lot of linear algebra, requiring a bit of linear algebra knowledge is unavoidable. We expect you have some familiarity with matrices and the basic operations you can do with them: multiplication, addition, and so on.
If you want to best understand the concepts of this book, we think it would be valuable for you to come in with some background in machine learning.
You should also probably have some background in programming - we’ll mainly be using Python to build and explore our networks. If you don’t have too much of a Python or math background, don’t worry - we’ll link some resources to give you a head start.
If you’ve never used Jupyter, don’t worry about it. It is a great tool to have in your toolbox and it’s easy to learn. We’ll also link some resources for you if you are not familiar with Python’s scientific libraries, like numpy, scipy, networkx, and scikit-learn, and a hands-on approach to get you started installing and leveraging these tools.
If you care about what’s under the hood mathematically, we have appendices which isolate the theoretical underpinnings of the techniques developed herein - you should have a reasonable understanding of college-level math, such as calculus, linear algebra, probability, and statistics for these sections.
Roadmap#
This book is organized into four parts.
Part I, Foundations, gives you a brief overview of the kinds of things you’ll be doing in this book, and shows you how to solve a network machine learning problem from start to finish. It covers the following topics:
What a network is and where you can find networks in the wild
All the reasons why you should care about studying networks
Examples of ways you could apply network machine learning to your own projects
An overview of the types of problems network machine learning is good at dealing with
The main challenges you’d encounter if you explored Network Learning more deeply
Exploring a real network machine learning dataset, to get a broad understanding of what you might be able to learn
Part II, Representations, is all about how we can represent networks statistically, and what we can do with those representations. It covers the following topics:
Ways you can represent individual networks
Ways you can represent groups of networks
The various useful properties different types of networks have
Types of network representations and why they’re useful
How to represent networks as a bunch of points in space
How to represent multiple networks
How to represent networks when you have extra information about your nodes
Part III, Applications, is about using the representations from Part II to explore and exploit your networks. It covers the following topics:
Figuring out if communities in your networks are different from each other
Selecting a reasonable model to represent your data
Finding nodes, edges, or communities in your networks that are interesting
Finding time points which are anomalies in a network that is evolving over time
What to do when you have new data after you’ve already trained a network model
How hypothesis testing works on networks
Figuring out which nodes are the most similar in a pair of networks
Part IV, the Appendix, is about providing a more rigorous background in the techniques and approaches described throughout the book. It covers a range of topics found throughout the book, and provides useful academic resources you can explore on your own if you want to delve further into the inner workings of network machine learning.
Other resources#
Many resources exist which will help you greatly with the content of this book.
If you don’t have any background in machine learning quite yet, our favorite starting point is Hands on machine learning, by Aurélien Géron. We would recommend starting with an introduction to machine learning prior to focusing on this book, because many of the concepts and ideas of this text will make more sense coming in with a machine learning background, however brief. The core ideas you should remember are the types of machine learning problems, some of the more common algorithms and techniques for machine learning (K-Means, testing, and validation each come up a few times), and the basic data structures used for machine learning.
To our knowledge, there are no other books which explicitly focus on network machine learning for single and multiple network problems just yet. If you want some more exposure to networks in general, we would recommend the following works:
Mohammed Al-Taie and Seifendine Kandry’s Python for Graph and Network Analysis (Springer) which presents network analysis techniques in
python.Ulrik Brandes and Thomas Erlebach’s Network Analysis (Springer) which focuses on the development of the network data structure and summary statistics for networks.
Douglas Luke’s A User’s Guide to Network Analysis in R (Springer) which provides a hands-on introduction to network analytics techniques in the
Rprogramming language.Eric Kolaczyk’s Statistical Analysis of Network Data (Springer) which presents some statistical models and methods for network science.
If you want to have a good understanding of the appendices, we would recommend that you start with the book Numerical Linear Algebra, by Lloyd Trefethan and David Bau. You will also want to have some exposure to basic statistics and statistical inference; a good introduction is Statistical Inference by Casella and Berger, and a good refresher is Mathematical Statistics by Bickel and Doksum. It may also be helpful to be explicitly introduced to statistical learning; our favorite is Introduction to Statistical Learning, by Gareth Jones, Daniela Witten, Trevor Hastie, and Rob Tibshirani.
Conventions used in this book#
The following conventions are used in this book:
Italic: indicates emphasis behind a term or exclamation to draw attention that this is the sentence in which it is being used.
Bold: indicates a definition for a term or concept.
Unicode block: used to indicate the name of an algorithm, function names, package names, programmatic text elements, and related concepts.
Admonitions
Used to indicate ideas that are directly relevant or supplementary to the content of the book, but are not essential for understanding the main concepts of a section or paragraph.
Code examples#
The entirety of this book has been compiled using jupyter notebooks, integrated through the jupyter-book framework. The book is currently hosted on github at github.com/neurodata/graph-stats-book, and the build log for the text can be found at github.com/neurodata/graph-stats-book/actions. You can find every section notebook, and every command which was used to prepare the environment in which the corresponding textbook pages were executed, using those two links.
All of the code used to prepare simulations, algorithms, or figures are contained within this book. This means that to recreate a figure for a particular section, you just need to run the corresponding code provided. In general, all code relevant to an algorithm or simulation are shown explicitly. For example, a python code block, and its corresponding output, looks like this:
def howdy_world():
    print("Howdy world!")

howdy_world()
Howdy world!
Sometimes, there will be code sections that aren’t really relevant to the message being conveyed. These code blocks, which may include calls to plotting methods the user has seen before, or redundant blocks that only add styling to figures or the like, will generally be hidden if we think that they detract from the overall flow of a section. These blocks will look like this:
def howdy_hidden():
    print("Howdy world, but I'm hidden!")

howdy_hidden()
Howdy world, but I'm hidden!
When we cover how to set up an environment with graspologic, we occassionally demonstrate bash commands to be used from a terminal. These commands can be identified by code blocks that instead look like this, where the echo command just prints back the string you pass it:
$ echo "this is a bash command"
The $ indicates the start of the line, and is not part of what you actually type. If we want to tell you what you should anticipate output wise for a bash command, it will look like this:
$ echo "this is what the output looks like"
this is what the output looks like
Using code examples, citing the book, and reaching out with feedback#
This book is intended to teach you how to develop code for network machine learning. In general, we are providing this code for you: it is intended that you will borrow and repurpose the code and techniques we describe in your programs and documentation. If you are using a few brief snippets from our book for your work, feel free with proper attribution to our citation (below). If you want to write a program that borrows some code, feel free without permission. If you intend to sell or financially profit directly from code we provide in this book, you need to request permission.
To cite our textbook, you can use the following citation:
Eric W. Bridgeford, Alex Loftus, and Joshua T. Vogelstein. Hands-on Network Machine Learning with Scikit-Learn and Graspologic. NeuroData, http://docs.neurodata.io/graph-stats-book/coverpage.html.
To request permissions, provide us with feedback about our in-progress draft, or even just to say hi and let us know what network machine learning concepts you want to see us discuss, feel free to reach out to the authors directly. You can reach out to us at ericwb95 - at - gmail - dot - com. Hopefully you can piece together how to turn that into a valid email address; as much as I love spam, I don’t :)
Section Contributors#
Dr. Jesús Daniel Arroyo is an Assistant Professor in the Department of Statistics at Texas A&M University. He focuses on the theoretical underpinnings of statistical network analysis, machine learning, and high-dimensional data analysis, including topics such as spectral graph inference, dimensionality reduction, convex optimization, and graph matching. Jesús tends to focus on the applications of his work to neuroimaging data in statistical connectomics.
Ali Saad-Eldin is a software engineer at Amazon. As a masters student at Johns Hopkins University in Applied Mathematics and Statistics, Ali focused his attention on optimization techniques for solving problems in graph analysis. He was a core contributor to the graspologic package and developed the submodule for graph matching.
Sambit Panda is a PhD student at Johns Hopkins University in the Department of Biomedical Engineering. Sambit’s work focuses on nonparametric hypothesis testing for large datasets, with applications in neuroimaging. He was a core contributor to the hyppo package, which is a python framework for hypothesis testing.
Jason Yim is a PhD student in the Department of Electrical Engineering and Computer Science (EECS) at MIT, where he develops generative models for de-novo protein design. Prior to starting his PhD, Jason focused on the application of neural networks to protein folding and macular degeneration with DeepMind, a company focused on artificial intelligence that was acquired by Google in 2014.
Advisors#
Dr. Carey E. Priebe is Professor of Applied Mathematics and Statistics, and a founding member of the Center for Imaging Science (CIS) and the Mathematical Institute for Data Science (MINDS) at Johns Hopkins University. He is a leading researcher in theoretical, methodological, and applied statistics / data science; much of his recent work focuses on spectral network analysis and subsequent statistical inference. Professor Priebe is Senior Member of the IEEE, Elected Member of the International Statistical Institute, Fellow of the Institute of Mathematical Statistics, and Fellow of the American Statistical Association.
Dr. Christopher M. White is Managing Director, Microsoft Research Special Projects. He leads mission-oriented research and software development teams focusing on high risk problems. Prior to joining Microsoft and working as a DARPA program manager, he was a Fellow at Harvard for network statistics and machine learning. Chris’s work has been featured in media outlets including Popular Science, CBS’s 60 Minutes, CNN, the Wall Street Journal, Rolling Stone Magazine, TEDx, and Google’s Solve for X. Chris was profiled in a cover feature for the Sept/Oct 2016 issue of Popular Science.
Weiwei Yang is a Principal Development Manager at Microsoft Research. Her interests are in resource efficient alt-SGD ML methods inspired by biological learning. The applied research group she leads aims to democratize AI by addressing issues of sustainability, robustness, scalability, and efficiency in ML. Her group has applied ML to address social issues such as countering human trafficking and to energy grid stabilizations.
Acknowledgements#
We want to offer a big thanks to everybody who has been reading the book as we write and giving feedback. So far, this list includes Dax Pryce, Ross Lawrence, Geoff Loftus, Alexandra McCoy, Olivia Taylor, and Peter Brown. Further, we want to give special acknowledgements to all of the wonderful works that have allowed us to produce this book. Academic-focused books are developed as much by the authors as they are by the many wonderful contributors that developed the works that comprise this book. Throughout many sections of this book, we’ll list out the key papers that you can check out that led to the insights that go into each section at the end of the section. You can use these papers in conjunction with the appendix (where applicable) to find more detailed and technical descriptions of the particular algorithms and techniques we describe in this book.