Why do we study networks?
Contents
1.2. Why do we study networks?#
When you start thinking, you start seeing networks everywhere. The objects could be people, and the edges could be friendships. Or they could be computers, and the relationship could be the information they send to each other. You’d have airflight networks if you’re working in air traffic control, where the edges are flights from city A to B; or if you’re an epidemiologist studying disease, you could create an infection network. Neuroscientists can explore brain networks, which tell them about neurons and their relationships with each other, and computer scientists often use neural networks, which have become pillars in machine learning.
Networks can even be used to visualize ideas: in a Bayesian network, your nodes represent a set of variables and the relationship between them is their conditional dependencies. In a correlation network, your nodes represent variables, and the edges represent the correlation between those variables. You can have ecological networks, electrical networks, gene networks, and you could visualize your team’s workflow with a network.
Even the way we think can be thought of as a network. Visualize a concept or object in your head. Maybe you could think about the food you had for breakfast this morning, or the city you live in. Now, think about the connections between those concepts and others. Maybe you had eggs and toast for breakfast. Eggs and toast are connected with a multitude of other concepts in your head: forks and silverware, kitchens, hunger, protein, carbohydrates, your morning routine, chickens, wheat, other breakfast foods, and an innumerable amount of other things. What you’re doing right now is exploring a small part of the massive semantic network that lives in your head.
Network machine learning is a relatively new field. The vast majority of it has been invented (or discovered) after the year 2000, and many fundamental proofs have only been published recently.
For the business-minded folks out there, this is an incredible time to learn about networks. Graph neural networks (GNNs) are becoming increasingly popular as deep learning and neural networks explode. This book provides the basic foundational concepts and intuition required to understand how, when, and why GNNs, or any other network machine learning tool, work.
Real-life applications also follow a general trend. You’ll see academia spend a lot of time, usually 10-20 years, publishing proof-of-concept papers, discussing possible approaches to solve problems, and developing fundamental tools (usually informally, with somewhat messy code that exists in jupyter notebooks). Then, as the field of research starts maturing, companies and industry people start noticing these new academic tools. They find ways to apply them to make their product or service better, and easy-to-use packages like scikit-learn are developed to make these academic tools mainstream. Network machine learning is at a tipping point right now: its academic foundations have been built up over the past 10-20 years, and the tools for building and working with networks are now starting to move from academia to industry. Congratulations: you could get in early for a wave of application-focused network machine learning tools!
1.2.1. A Brief History of Network Machine Learning#
Networks have been thought about in one form or another since the 1700’s, when Leonhard Euler kickstarted the field with a famous problem about bridges in a city called called Königsberg [1]. Graph theory, which falls in the intersection of network theory and data science in Fig. 2, mainly existed as a niche subfield of mathematics for a great deal of time, slowly growing.
That all changed with the development of more powerful computational tools, as well as the emergence of the internet and in particular social media platforms. Suddenly, there was a tsunami of real data flowing in, and not enough mathematical background or computational tools to understand it properly.
Thousands of papers are published in the field of network machine learning. Many of these focus on community-finding methods, which we’ll see a lot of in this book. More recently, tools for dealing with multiple networks at once started coming into their own, and easy-to-use Python packages like networkx and graspologic, which we’ll use regularly, are becoming prominent.
1.2.2. Types of networks we won’t discuss#
The network data structure has quickly become a go-to across many domains of science and industry. One application of networks is particularly appealing: networks can be used to succinctly conceptualize and visualize underlying relationships that exist outside of just network-valued data. Two of the most prominent applications of this concept use machinery known as a Directed Acyclic Graph (DAG) to conceptualize the “flow” between different elements in the underlying system. Remember that a graph is another name for a network, so this concept is inherently rooted in networks.
For instance, let’s consider a somewhat contrived example. It seems pretty well-established that smoking causes cancer. However, there are some other factors that cause cancer, too: people might be genetically predisposed to lung cancer (genetic predisposition), and old people in general might be at a higher risk of lung cancer (age). As it turns out, you can use a network, where the nodes are the factors that you are interested in (smoking status, cancer, age, and genetic predisposition), to construct a diagram of the system that you are studying, shown in Fig. 1.4.
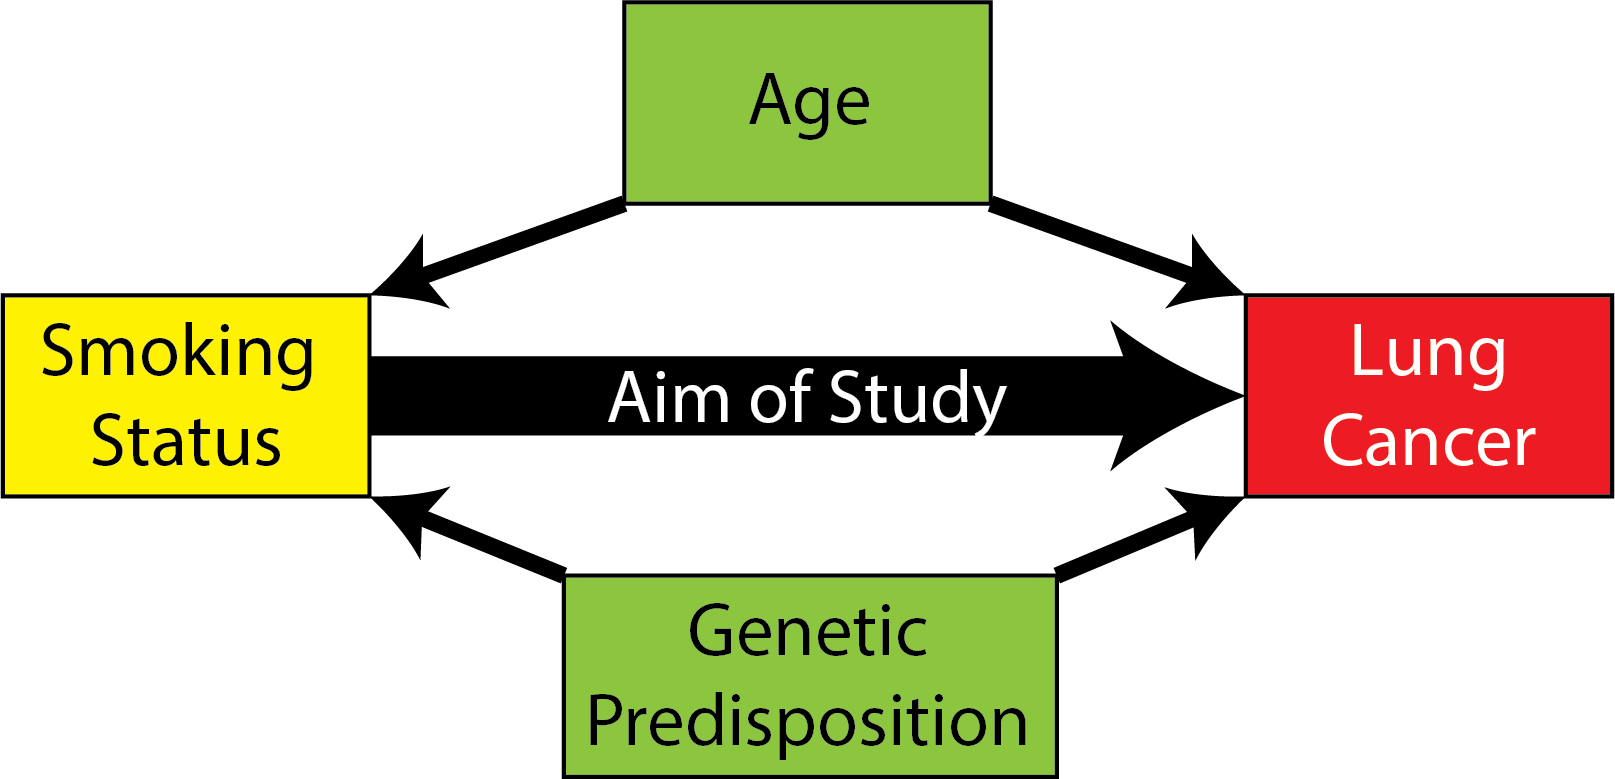
Fig. 1.4 The direction of these factors is determined by which factor influences which factor. For instance, smoking causes cancer, so we put an arrow from smoking to cancer. Age and genetic predisposition can lead one to being a smoker (older people might be more likely to smoke, and people might be predisposed to addictive behaviors by their genetics). Likewise, these factors can make a person more likely to develop cancer. Therefore, they each get arrows to both smoking and cancer. Cancer can cause genetic changes, but it cannot cause genetic predisposition to cancer, since genetic predisposition is determined when a person is born. Likewise, cancer does not cause smoking nor aging, so no arrows go from cancer to anything else. The aim of your study is to decide how big of a factor smoking status is on cancer.#
This diagram of the system is, in fact, a network. The nodes are the factors you are studying (smoking status, cancer, age, and genetic predisposition), and the edges are the relationships that exist between these different factors. This network is often called a Bayesian network, in that it illustrates a set of factors and the conditional dependencies between them via a DAG. Some introductory material for Bayesian networks can be found in [2], [3], and [4].
Problematically, if you wanted to study how much lung cancer is impacted by smoking, you would not be able to just take a group of smokers, and a group of non-smokers, and compare the rates at which they get lung cancer. Rather, to be really precise, you would probably want to make sure that the smokers and non-smokers were similar on these other factors that could lead to lung cancer, too (you would probably want the groups of smokers you collect to have similar ages, and have similar genetic predisposition for lung cancer). For instance, if you collected a group of very young smokers with low genetic risk for cancer, and compared them to a group of very old non-smokers with a very high genetic risk for cancer, your data might show that the smoker group actually has a lower rate of lung cancer than the non-smoker group simply because you did not have a cohesive understanding of the underlying system before you collected your groups of people to study (and in so doing, ignored the DAG shown above). In this respect, studying these types of networks motivates directly how you will study the problem that you are interested in.
This form of analysis is a popular route to conducting causal inference (or, the study of how to determine causes), and there are many excellent works on the topic, such as [5] and [6].
These and many other applications of networks are extremely interesting, relevant, and worthy of dedicated study. That said, they will not be our focus here. The reason is that this book focuses specifically on the use of networks when the data itself is a network or collection of networks, and not on the use of networks as a description of an underlying system for data (which, in many cases, will not be network data).
1.2.3. References#
- 1
Stephan C. Carlson. Königsberg bridge problem. Encyclopedia Britannica, April 2006. URL: https://www.britannica.com/science/Konigsberg-bridge-problem.
- 2
Judea Pearl. Bayesian networks. October 2011. [Online; accessed 22. Mar. 2023]. URL: https://escholarship.org/uc/item/53n4f34m.
- 3
Marco Scutari and Jean-Baptiste Denis. Bayesian Networks: With Examples in R (Chapman & Hall/CRC Texts in Statistical Science). Chapman and Hall/CRC, June 2014. ISBN 978-1-48222558-7. URL: https://www.amazon.com/Bayesian-Networks-Examples-Chapman-Statistical/dp/1482225581.
- 4
Richard E. Neapolitan. Learning Bayesian Networks. Pearson, London, England, UK, May 2019. ISBN 978-0-13012534-7. URL: https://www.amazon.com/Learning-Bayesian-Networks-Richard-Neapolitan/dp/0130125342.
- 5
Judea Pearl, Madelyn Glymour, and Nicholas P. Jewell. Causal Inference in Statistics - A Primer. Wiley, Hoboken, NJ, USA, February 2016. ISBN 978-1-11918684-7. URL: https://www.amazon.com/Causal-Inference-Statistics-Judea-Pearl/dp/1119186846.
- 6
Robins Hernan. Causal Inference:What If. Taylor & Francis, Andover, England, UK, May 2023. ISBN 978-1-31537493-2. doi:10.1201/9781315374932.