Note
Go to the end to download the full example code.
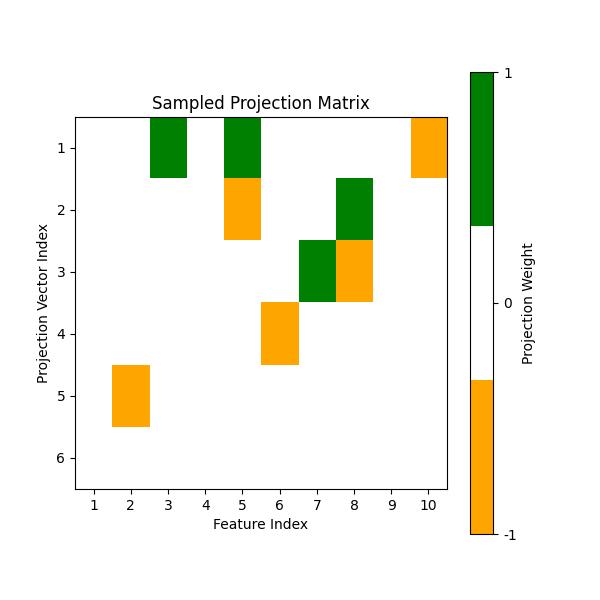
Plot the sparse projection matrices of an oblique tree#
This example shows how projection matrices are generated for an oblique tree,
specifically the treeple.tree.ObliqueDecisionTreeClassifier.
The projection matrix here samples a subset of features from the input X
controlled by the parameter feature_combinations. The projection matrix
is sparse when feature_combinations is small, meaning that it is mostly zero.
The non-zero elements of the projection matrix are the features that are sampled
from the input X and linearly combined to form candidate split dimensions.
For details on how to use the hyperparameters related to the patches, see
treeple.tree.ObliqueDecisionTreeClassifier.
import matplotlib.pyplot as plt

# import modules
# .. note:: We use a private Cython module here to demonstrate what the patches
#           look like. This is not part of the public API. The Cython module used
#           is just a Python wrapper for the underlying Cython code and is not the
#           same as the Cython splitter used in the actual implementation.
#           To use the actual splitter, one should use the public API for the
#           relevant tree/forests class.
import numpy as np
from matplotlib.cm import ScalarMappable
from matplotlib.colors import ListedColormap

from treeple._lib.sklearn.tree._criterion import Gini
from treeple.tree._oblique_splitter import BestObliqueSplitterTester
Initialize patch splitter#
The patch splitter is used to generate patches for the projection matrices. We will initialize the patch with some dummy values for the sake of this example.
criterion = Gini(1, np.array((0, 1)))
max_features = 6
min_samples_leaf = 1
min_weight_leaf = 0.0
random_state = np.random.RandomState(1)

feature_combinations = 1.5
monotonic_cst = None
missing_value_feature_mask = None

n_features = 10
n_samples = 5

# initialize some dummy data
X = np.ones((n_samples, n_features), dtype=np.float32)
y = np.array([0, 0, 0, 1, 1]).reshape(-1, 1).astype(np.float64)
sample_weight = np.ones(5)

print("The shape of our dataset is: ", X.shape, y.shape, sample_weight.shape)
The shape of our dataset is: (5, 10) (5, 1) (5,)
Initialize the splitter#
The splitter is initialized in the decision-tree classes, but we expose a testing interface here to demonstrate how the projection matrices are sampled internally.
Warning
Do not use this interface directly in practice.
splitter = BestObliqueSplitterTester(
    criterion,
    max_features,
    min_samples_leaf,
    min_weight_leaf,
    random_state,
    monotonic_cst,
    feature_combinations,
)
splitter.init_test(X, y, sample_weight, missing_value_feature_mask)
Generate projection matrix#
Sample the projection matrix that consists of randomly sampled features
with an average of feature_combinations * max_features non-zeros
in the (max_features, n_features) matrix.
projection_matrix = splitter.sample_projection_matrix_py()
print(projection_matrix.shape)

# Visualize the projection matrix
cmap = ListedColormap(["orange", "white", "green"])

# Create a heatmap to visualize the indices
fig, ax = plt.subplots(figsize=(6, 6))

ax.imshow(projection_matrix, cmap=cmap, aspect=n_features / max_features, interpolation="none")

ax.set(title="Sampled Projection Matrix", xlabel="Feature Index", ylabel="Projection Vector Index")
ax.set_xticks(np.arange(n_features))
ax.set_yticks(np.arange(max_features))
ax.set_yticklabels(np.arange(max_features, dtype=int) + 1)
ax.set_xticklabels(np.arange(n_features, dtype=int) + 1)

# Create a mappable object
sm = ScalarMappable(cmap=cmap)
sm.set_array([])  # You can set an empty array or values here

# Create a color bar with labels for each feature set
colorbar = fig.colorbar(sm, ax=ax, ticks=[0, 0.5, 1], format="%d")
colorbar.set_label("Projection Weight")
colorbar.ax.set_yticklabels(["-1", "0", "1"])

plt.show()
(6, 10)
Discussion#
As we can see, the (sparse) oblique splitter samples random features to linearly combine to form candidate split dimensions.
In contrast, the normal splitter in sklearn.tree.DecisionTreeClassifier samples
randomly across all n_features features.
For an example of using oblique trees/forests in practice on data, see the following examples:
Compare the decision surfaces of oblique extra-trees with standard oblique trees
Plot oblique forest and axis-aligned random forest predictions on cc18 datasets
Total running time of the script: (0 minutes 3.521 seconds)
Estimated memory usage: 224 MB