Note
Go to the end to download the full example code.
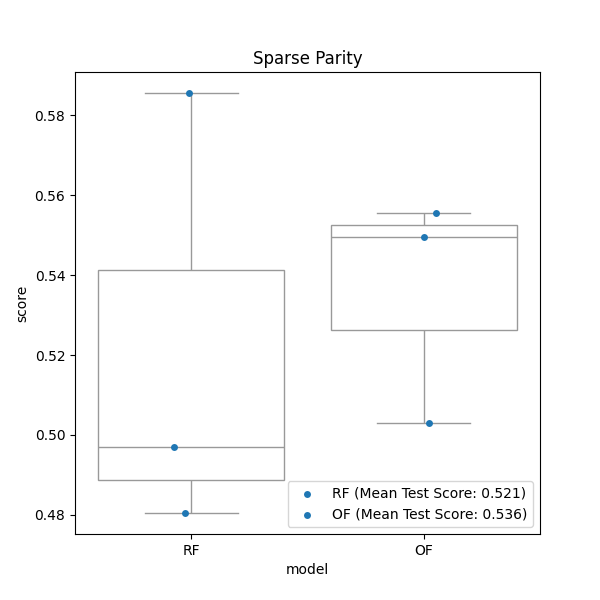
Plot oblique forest and axis-aligned random forest predictions on sparse parity simulation#
A performance comparison between oblique forest and standard axis-
aligned random forest using sparse parity simulation dataset.
Sparse parity is a variation of the noisy parity problem,
which itself is a multivariate generalization of the noisy XOR problem.
This is a binary classification task in high dimensions. The simulation
will generate uniformly distributed n_samples number of sample points
in the range of -1 and +1 with p number of features. p* is a
parameter used to limit features that carry information about the class.
The informative binary label is then defined as 1 if there are odd number
of the sum of data X across first p* features that are greater than 0,
otherwise the label is defined as 0. The simulation is further detailed
in this [publication](https://epubs.siam.org/doi/epdf/10.1137/1.9781611974973.56).
It took 7 seconds to run the script
from datetime import datetime

import matplotlib.pyplot as plt
import numpy as np
import pandas as pd
import seaborn as sns
from sklearn.ensemble import RandomForestClassifier
from sklearn.model_selection import RepeatedKFold, cross_validate

from treeple import ObliqueRandomForestClassifier

random_state = 123456
t0 = datetime.now()


def sparse_parity(n_samples, p=20, p_star=3, random_seed=None, **kwargs):
    if random_seed:
        np.random.seed(random_seed)

    X = np.random.uniform(-1, 1, (n_samples, p))
    y = np.zeros(n_samples)

    for i in range(0, n_samples):
        y[i] = sum(X[i, :p_star] > 0) % 2

    return X, y


def get_scores(X, y, n_cv=5, n_repeats=1, random_state=1, kwargs=None):
    clfs = [
        RandomForestClassifier(**kwargs[0], random_state=random_state),
        ObliqueRandomForestClassifier(**kwargs[1], random_state=random_state),
    ]

    tmp = []

    for i, clf in enumerate(clfs):
        cv = RepeatedKFold(n_splits=n_cv, n_repeats=n_repeats, random_state=random_state)
        test_score = cross_validate(estimator=clf, X=X, y=y, cv=cv, scoring="accuracy")

        tmp.append([["RF", "OF"][i], test_score["test_score"], test_score["test_score"].mean()])

    df = pd.DataFrame(tmp, columns=["model", "score", "mean"])
    df = df.explode("score")
    df["score"] = df["score"].astype(float)
    df.reset_index(inplace=True, drop=True)

    return df


# Grid searched hyper-parameters
params = [
    {"max_features": None, "n_estimators": 100, "max_depth": None},
    {"max_features": 40, "n_estimators": 100, "max_depth": 20},
]

X, y = sparse_parity(n_samples=1000, random_seed=random_state)

df = get_scores(X=X, y=y, n_cv=3, n_repeats=1, random_state=random_state, kwargs=params)
t_d = (datetime.now() - t0).seconds
print(f"It took {t_d} seconds to run the script")

# Draw a comparison plot
fig, ax = plt.subplots(1, 1, figsize=(6, 6))

sns.stripplot(data=df, x="model", y="score", ax=ax, dodge=True)
sns.boxplot(data=df, x="model", y="score", ax=ax, color="white")
ax.set_title("Sparse Parity")

rf = df.query('model=="RF"')["mean"].iloc[0]
rff = f"RF (Mean Test Score: {round(rf,3)})"

of = df.query('model=="OF"')["mean"].iloc[0]
off = f"OF (Mean Test Score: {round(of,3)})"

ax.legend([rff, off], loc=4)

plt.savefig(f"plot_sim_{t_d}s.jpg")
plt.show()
Total running time of the script: (0 minutes 7.712 seconds)
Estimated memory usage: 228 MB