Note
Go to the end to download the full example code.
Demonstrate and visualize a multi-view projection matrix for an axis-aligned tree#
This example shows how multi-view projection matrices are generated for a decision tree,
specifically the treeple.tree.MultiViewDecisionTreeClassifier.
Multi-view projection matrices operate under the assumption that the input X array
consists of multiple feature-sets that are groups of features important for predicting
y.
For details on how to use the hyperparameters related to the multi-view, see
treeple.tree.MultiViewDecisionTreeClassifier.
# import modules
# .. note:: We use a private Cython module here to demonstrate what the patches
#           look like. This is not part of the public API. The Cython module used
#           is just a Python wrapper for the underlying Cython code and is not the
#           same as the Cython splitter used in the actual implementation.
#           To use the actual splitter, one should use the public API for the
#           relevant tree/forests class.

import matplotlib.pyplot as plt
import numpy as np
from matplotlib.cm import ScalarMappable
from matplotlib.colors import ListedColormap

from treeple._lib.sklearn.tree._criterion import Gini
from treeple.tree._oblique_splitter import MultiViewSplitterTester

criterion = Gini(1, np.array((0, 1)))
max_features = 5
min_samples_leaf = 1
min_weight_leaf = 0.0
random_state = np.random.RandomState(10)

# we "simulate" three feature sets, with 3, 2 and 4 features respectively
feature_set_ends = np.array([3, 5, 9], dtype=np.intp)
n_feature_sets = len(feature_set_ends)

max_features_per_set_ = None
feature_combinations = 1
monotonic_cst = None
missing_value_feature_mask = None

# initialize some dummy data
X = np.repeat(np.arange(feature_set_ends[-1]).astype(np.float32), 5).reshape(5, -1)
y = np.array([0, 0, 0, 1, 1]).reshape(-1, 1).astype(np.float64)
sample_weight = np.ones(5)

print("The shape of our dataset is: ", X.shape, y.shape, sample_weight.shape)
The shape of our dataset is: (5, 9) (5, 1) (5,)
Initialize the multi-view splitter#
The multi-view splitter is a Cython class that is initialized internally in treeple. However, we expose a Python tester object to demonstrate how the splitter works in practice.
Warning
Do not use this interface directly in practice.
splitter = MultiViewSplitterTester(
    criterion,
    max_features,
    min_samples_leaf,
    min_weight_leaf,
    random_state,
    monotonic_cst,
    feature_combinations,
    feature_set_ends,
    n_feature_sets,
    max_features_per_set_,
)
splitter.init_test(X, y, sample_weight, missing_value_feature_mask)
Sample the projection matrix#
The projection matrix is sampled by the splitter. The projection
matrix is a (max_features, n_features) matrix that selects which features of X
to define candidate split dimensions. The multi-view
splitter’s projection matrix though samples from multiple feature sets,
which are aligned contiguously over the columns of X.
projection_matrix = splitter.sample_projection_matrix_py()
print(projection_matrix)

cmap = ListedColormap(["white", "green"][:n_feature_sets])

# Create a heatmap to visualize the indices
fig, ax = plt.subplots(figsize=(6, 6))

ax.imshow(
    projection_matrix, cmap=cmap, aspect=feature_set_ends[-1] / max_features, interpolation="none"
)
ax.axvline(feature_set_ends[0] - 0.5, color="black", linewidth=1, label="Feature Sets")
for iend in feature_set_ends[1:]:
    ax.axvline(iend - 0.5, color="black", linewidth=1)

ax.set(title="Sampled Projection Matrix", xlabel="Feature Index", ylabel="Projection Vector Index")
ax.set_xticks(np.arange(feature_set_ends[-1]))
ax.set_yticks(np.arange(max_features))
ax.set_yticklabels(np.arange(max_features, dtype=int) + 1)
ax.set_xticklabels(np.arange(feature_set_ends[-1], dtype=int) + 1)
ax.legend()

# Create a mappable object
sm = ScalarMappable(cmap=cmap)
sm.set_array([])  # You can set an empty array or values here

# Create a color bar with labels for each feature set
colorbar = fig.colorbar(sm, ax=ax, ticks=[0.25, 0.75], format="%d")
colorbar.set_label("Projection Weight (I.e. Sampled Feature From a Feature Set)")
colorbar.ax.set_yticklabels(["0", "1"])

plt.show()
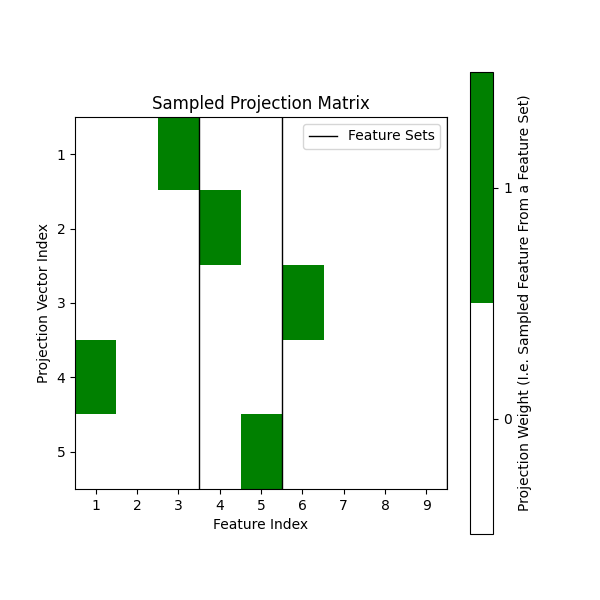
[[0. 0. 1. 0. 0. 0. 0. 0. 0.]
 [0. 0. 0. 1. 0. 0. 0. 0. 0.]
 [0. 0. 0. 0. 0. 1. 0. 0. 0.]
 [1. 0. 0. 0. 0. 0. 0. 0. 0.]
 [0. 0. 0. 0. 1. 0. 0. 0. 0.]]
Sampling split candidates scaled to each feature-set dimensionality#
In the previous setup, we do not specify the max_features_per_set parameter.
This results in the splitter sampling from all features uniformly. However, we can
also specify max_features_per_set to sample from each feature set with a different
scaling factor. For example, if we want to sample from the first feature set three times
more than the second feature set, we can specify max_features_per_set as follows:
max_features_per_set = [3, 1]. This will sample from the first feature set three times
and the second feature set once.
Note
In practice, this is controlled by the apply_max_features_per_feature_set parameter
in treeple.tree.MultiViewDecisionTreeClassifier.
max_features_per_set_ = np.array([1, 2, 3], dtype=int)
max_features = np.sum(max_features_per_set_)

splitter = MultiViewSplitterTester(
    criterion,
    max_features,
    min_samples_leaf,
    min_weight_leaf,
    random_state,
    monotonic_cst,
    feature_combinations,
    feature_set_ends,
    n_feature_sets,
    max_features_per_set_,
)
splitter.init_test(X, y, sample_weight, missing_value_feature_mask)

# Here, we sampled 1 feature from the first feature set, 2 features from the second feature set
# and 3 features from the third feature set.
projection_matrix = splitter.sample_projection_matrix_py()
print(projection_matrix)

# Create a heatmap to visualize the indices
fig, ax = plt.subplots(figsize=(6, 6))

ax.imshow(
    projection_matrix, cmap=cmap, aspect=feature_set_ends[-1] / max_features, interpolation="none"
)
ax.axvline(feature_set_ends[0] - 0.5, color="black", linewidth=1, label="Feature Sets")
for iend in feature_set_ends[1:]:
    ax.axvline(iend - 0.5, color="black", linewidth=1)

ax.set(title="Sampled Projection Matrix", xlabel="Feature Index", ylabel="Projection Vector Index")
ax.set_xticks(np.arange(feature_set_ends[-1]))
ax.set_yticks(np.arange(max_features))
ax.set_yticklabels(np.arange(max_features, dtype=int) + 1)
ax.set_xticklabels(np.arange(feature_set_ends[-1], dtype=int) + 1)
ax.legend()

# Create a mappable object
sm = ScalarMappable(cmap=cmap)
sm.set_array([])  # You can set an empty array or values here

# Create a color bar with labels for each feature set
colorbar = fig.colorbar(sm, ax=ax, ticks=[0.25, 0.75], format="%d")
colorbar.set_label("Projection Weight (I.e. Sampled Feature From a Feature Set)")
colorbar.ax.set_yticklabels(["0", "1"])

plt.show()
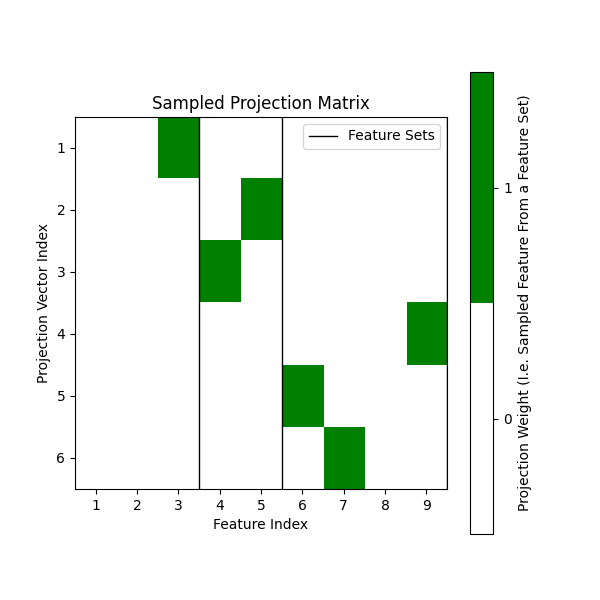
[[0. 0. 1. 0. 0. 0. 0. 0. 0.]
 [0. 0. 0. 0. 1. 0. 0. 0. 0.]
 [0. 0. 0. 1. 0. 0. 0. 0. 0.]
 [0. 0. 0. 0. 0. 0. 0. 0. 1.]
 [0. 0. 0. 0. 0. 1. 0. 0. 0.]
 [0. 0. 0. 0. 0. 0. 1. 0. 0.]]
Discussion#
As we can see, the multi-view splitter samples split candidates across the feature sets.
In contrast, the normal splitter in sklearn.tree.DecisionTreeClassifier samples
randomly across all n_features features because it is not aware of the multi-view structure.
This is the key difference between the two splitters.
For an example of using the multi-view splitter in practice on simulated data, see Analyze a multi-view dataset with a multi-view random forest.
Total running time of the script: (0 minutes 4.551 seconds)
Estimated memory usage: 224 MB