Note
Go to the end to download the full example code.
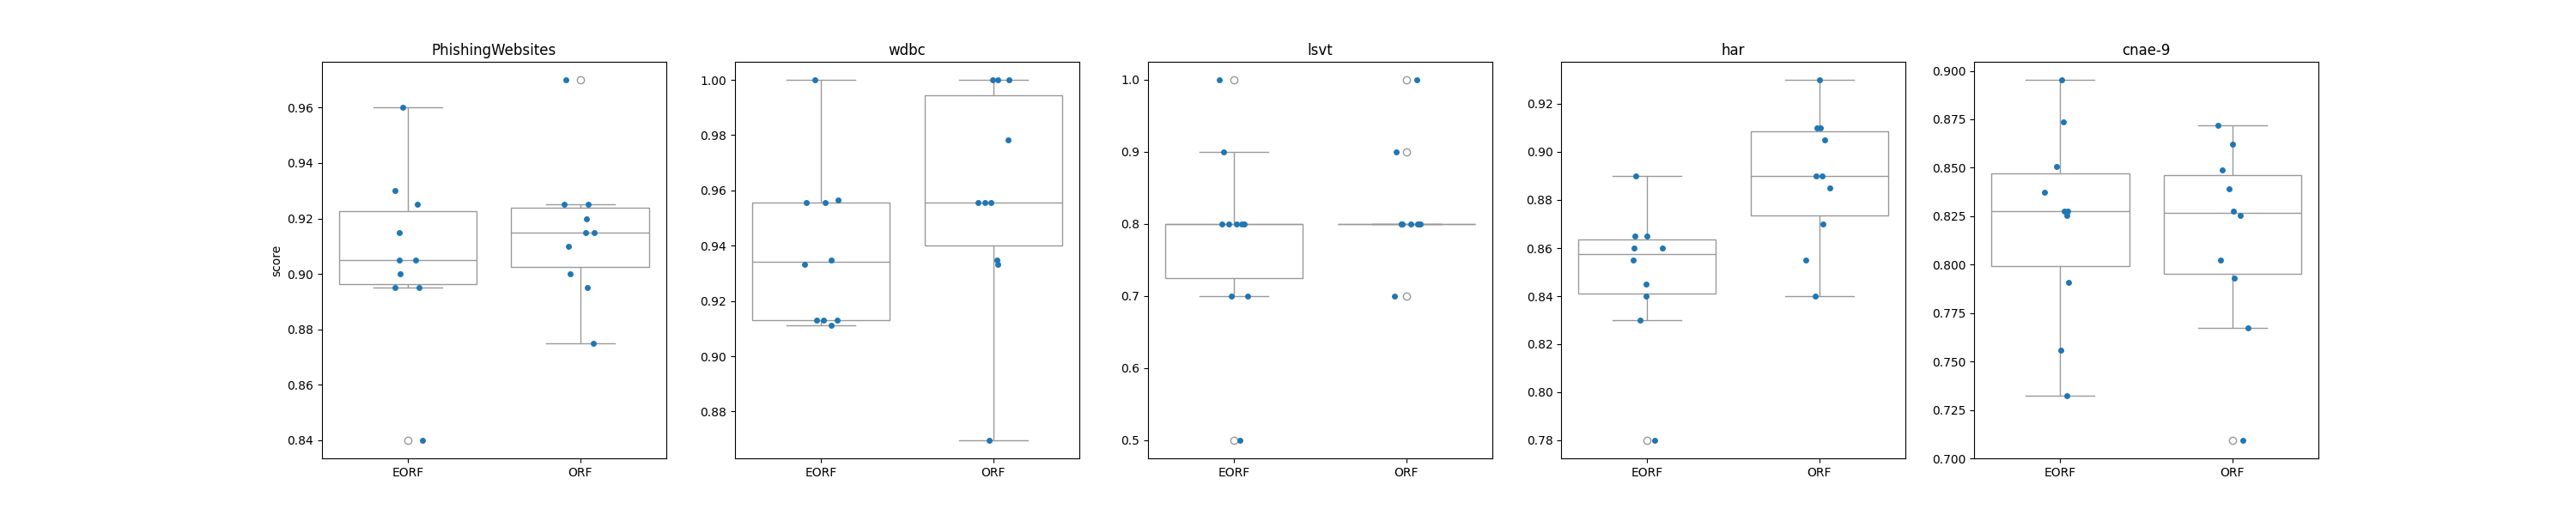
Compare extra oblique forest and oblique random forest predictions on cc18 datasets#
A performance comparison between extra oblique forest and standard oblique random forest using four datasets from OpenML benchmarking suites.
Extra oblique forest uses extra oblique trees as base model which differ from classic
decision trees in the way they are built. When looking for the best split to
separate the samples of a node into two groups, random splits are drawn for each
of the max_features randomly selected features and the best split among those is
chosen. This is in contrast with the greedy approach, which evaluates the best possible
threshold for each chosen split. For details of the original extra-tree, see [1].
The datasets used in this example are from the OpenML benchmarking suite are:
[Phishing Website](https://www.openml.org/search?type=data&sort=runs&id=4534)
[WDBC](https://www.openml.org/search?type=data&sort=runs&id=1510)
[Lsvt](https://www.openml.org/search?type=data&sort=runs&id=1484)
[har](https://www.openml.org/search?type=data&sort=runs&id=1478)
[cnae-9](https://www.openml.org/search?type=data&sort=runs&id==1468)
Large datasets are subsampled due to computational constraints for running
this example. Note that cnae-9 is
an high dimensional dataset with very sparse 856 features, mostly consisting of zeros.
Dataset |
# Samples |
# Features |
Datatype |
|---|---|---|---|
Phishing Website |
2000 |
30 |
nominal |
WDBC |
455 |
30 |
numeric |
Lsvt |
100 |
310 |
numeric |
har |
2000 |
561 |
numeric |
cnae-9 |
864 |
856 |
numeric |
Note
In the following example, the parameters max_depth and ‘max_features` are
set deliberately low in order to allow the example to run in our CI test suite.
For normal usage, these parameters should be set to appropriate values depending
on the dataset.
Discussion#
Extra Oblique Tree demonstrates performance similar to that of regular Oblique Tree on average with some increase in variance. See [1] for a detailed discussion on the bias-variance tradeoff of extra-trees vs normal trees.
However, Extra Oblique Tree runs substantially faster than Oblique Tree on some datasets due to
the random split process which omits the computationally expensive search for the best split.
The main source of increase in speed stems from the omission of sorting samples during the
splitting of a node. In the standard trees, samples are sorted in ascending order to determine the
best split hence the complexity is O(nlog(n)). In Extra trees, samples
are not sorted and the split is determined by randomly drawing a threshold from the feature’s
range, hence the complexity is O(n). This makes the algorithm more suitable for large datasets.
To see how sample-sizes affect the performance of Extra Oblique Trees vs regular Oblique Trees, see Speed of Extra Oblique Random Forest vs Oblique Random Forest on different dataset sizes
References#
             value
max_features  sqrt
n_estimators    50
max_depth        3
random_state   123
n_cv            10
n_repeats        1
n_jobs          -1
                                    time_taken
dataset          dimension   model
PhishingWebsites (2000, 30)  EORF     1.194296
                             ORF      1.190628
cnae-9           (864, 856)  EORF     1.249546
                             ORF      1.258247
har              (2000, 561) EORF     1.234861
                             ORF      1.960449
lsvt             (100, 310)  EORF     1.091442
                             ORF      0.981346
wdbc             (455, 30)   EORF     1.026877
                             ORF      0.955319
from datetime import datetime

import matplotlib.pyplot as plt
import pandas as pd
import seaborn as sns
from sklearn.datasets import fetch_openml
from sklearn.model_selection import RepeatedKFold, cross_validate

from treeple import ExtraObliqueRandomForestClassifier, ObliqueRandomForestClassifier

# Model parameters
max_depth = 3
max_features = "sqrt"
max_sample_size = 2000
random_state = 123
n_estimators = 50

# Datasets
phishing_website = 4534
wdbc = 1510
lsvt = 1484
har = 1478
cnae_9 = 1468

data_ids = [phishing_website, wdbc, lsvt, har, cnae_9]
df = pd.DataFrame()


def load_cc18(data_id):
    df = fetch_openml(data_id=data_id, as_frame=True, parser="pandas")

    # extract the dataset name
    d_name = df.details["name"]

    # Subsampling large datasets
    n = int(df.frame.shape[0] * 0.8)

    if n > max_sample_size:
        n = max_sample_size

    df = df.frame.sample(n, random_state=random_state)
    X, y = df.iloc[:, :-1], df.iloc[:, -1]

    return X, y, d_name


def get_scores(X, y, d_name, n_cv=5, n_repeats=1, **kwargs):
    clfs = [ExtraObliqueRandomForestClassifier(**kwargs), ObliqueRandomForestClassifier(**kwargs)]
    dim = X.shape
    tmp = []

    for i, clf in enumerate(clfs):
        t0 = datetime.now()
        cv = RepeatedKFold(n_splits=n_cv, n_repeats=n_repeats, random_state=kwargs["random_state"])
        test_score = cross_validate(estimator=clf, X=X, y=y, cv=cv, scoring="accuracy")
        time_taken = datetime.now() - t0
        # convert the time taken to seconds
        time_taken = time_taken.total_seconds()

        tmp.append(
            [
                d_name,
                dim,
                ["EORF", "ORF"][i],
                test_score["test_score"],
                test_score["test_score"].mean(),
                time_taken,
            ]
        )

    df = pd.DataFrame(tmp, columns=["dataset", "dimension", "model", "score", "mean", "time_taken"])
    df = df.explode("score")
    df["score"] = df["score"].astype(float)
    df.reset_index(inplace=True, drop=True)

    return df


params = {
    "max_features": max_features,
    "n_estimators": n_estimators,
    "max_depth": max_depth,
    "random_state": random_state,
    "n_cv": 10,
    "n_repeats": 1,
    "n_jobs": -1,
}

for data_id in data_ids:
    X, y, d_name = load_cc18(data_id=data_id)
    tmp = get_scores(X=X, y=y, d_name=d_name, **params)
    df = pd.concat([df, tmp])

# Show the time taken to train each model
print(pd.DataFrame.from_dict(params, orient="index", columns=["value"]))
print(df.groupby(["dataset", "dimension", "model"])[["time_taken"]].mean())

# Draw a comparison plot
d_names = df.dataset.unique()
N = d_names.shape[0]

fig, ax = plt.subplots(1, N)
fig.set_size_inches(6 * N, 6)

for i, name in enumerate(d_names):
    sns.stripplot(
        data=df.query(f'dataset == "{name}"'),
        x="model",
        y="score",
        ax=ax[i],
        dodge=True,
    )
    sns.boxplot(
        data=df.query(f'dataset == "{name}"'),
        x="model",
        y="score",
        ax=ax[i],
        color="white",
    )
    ax[i].set_title(name)
    if i != 0:
        ax[i].set_ylabel("")
    ax[i].set_xlabel("")
# show the figure
plt.show()
Total running time of the script: (0 minutes 36.470 seconds)
Estimated memory usage: 401 MB