Testing bilateral symmetry - semiparametric test
Preliminaries
import datetime
import pprint
import time

import matplotlib.pyplot as plt
import numpy as np
import pandas as pd
import seaborn as sns

from giskard.plot import scatterplot
from graspologic.inference import latent_position_test
from graspologic.utils import binarize, multigraph_lcc_intersection, symmetrize
from pkg.data import load_adjacency, load_node_meta
from pkg.io import get_out_dir, savefig
from pkg.plot import set_theme
from pkg.utils import get_paired_inds, get_paired_subgraphs, set_warnings

# from src.visualization import adjplot  # TODO fix graspologic version and replace here

set_warnings()


t0 = time.time()

RECOMPUTE = False

foldername = "semipar"


def stashfig(name, **kwargs):
    savefig(name, foldername=foldername, **kwargs)


out_dir = get_out_dir(foldername=foldername)

colors = sns.color_palette("Set1")
palette = dict(zip(["Left", "Right"], colors))
set_theme()
/Users/bpedigo/miniconda3/envs/maggot-revamp/lib/python3.8/site-packages/umap/__init__.py:9: UserWarning: Tensorflow not installed; ParametricUMAP will be unavailable
  warn("Tensorflow not installed; ParametricUMAP will be unavailable")
Load the data
Load node metadata and select the subgraphs of interest
meta = load_node_meta()
meta = meta[meta["paper_clustered_neurons"]]

adj = load_adjacency(graph_type="G", nodelist=meta.index)

lp_inds, rp_inds = get_paired_inds(meta)
left_meta = meta.iloc[lp_inds]
right_meta = meta.iloc[rp_inds]

ll_adj, rr_adj, lr_adj, rl_adj = get_paired_subgraphs(adj, lp_inds, rp_inds)

# TODO not sure what we wanna do about LCCs here
adjs, lcc_inds = multigraph_lcc_intersection([ll_adj, rr_adj], return_inds=True)
ll_adj = adjs[0]
rr_adj = adjs[1]
print(f"{len(lcc_inds)} in intersection of largest connected components.")

print(f"Original number of valid pairs: {len(lp_inds)}")

left_meta = left_meta.iloc[lcc_inds]
right_meta = right_meta.iloc[lcc_inds]
meta = pd.concat((left_meta, right_meta))
n_pairs = len(ll_adj)

print(f"Number of pairs after taking LCC intersection: {n_pairs}")
1210 in intersection of largest connected components.
Original number of valid pairs: 1211
Number of pairs after taking LCC intersection: 1210
Run a latent position test
if RECOMPUTE:
    preprocess = [symmetrize, binarize]
    graphs = [ll_adj, rr_adj]

    for func in preprocess:
        for i, graph in enumerate(graphs):
            graphs[i] = func(graph)

    ll_adj = graphs[0]
    rr_adj = graphs[1]
    n_bootstraps = 200
    test_case = "rotation"
    embedding = "ase"
    verbose = 1
    workers = -2
    rows = []
    for embedding in ["ase", "omnibus"]:
        for n_components in np.arange(6, 15):
            currtime = time.time()
            params = dict(
                embedding=embedding,
                n_components=n_components,
                test_case=test_case,
                n_bootstraps=n_bootstraps,
                workers=workers,
            )
            pvalue, tstat, misc = latent_position_test(ll_adj, rr_adj, **params)
            elapsed = time.time() - currtime

            row = params.copy()
            row["pvalue"] = pvalue
            row["tstat"] = tstat
            rows.append(row)
            results = pd.DataFrame(rows)
            results.to_csv(out_dir / "semipar_results")
            if verbose > 0:
                pprint.pprint(row)
                print()
results = pd.read_csv(out_dir / "semipar_results", index_col=0)
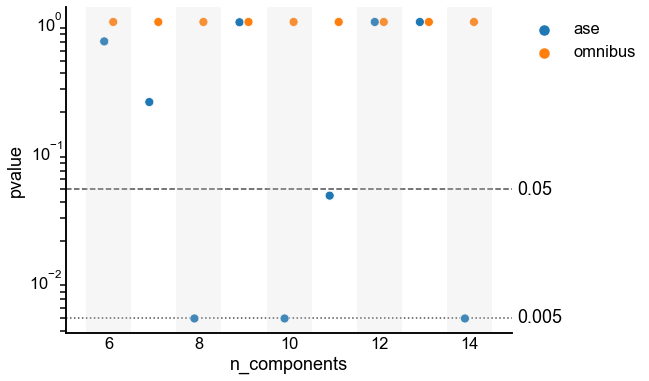
Plot p-values
ax = scatterplot(
    data=results,
    x="n_components",
    y="pvalue",
    hue="embedding",
    shift="embedding",
    shade=True,
)
ax.set_yscale("log")
styles = ["--", ":"]
line_locs = [0.05, 0.005]
line_kws = dict(color="black", alpha=0.7, linewidth=1.5, zorder=-1)
for loc, style in zip(line_locs, styles):
    ax.axhline(loc, linestyle=style, **line_kws)
    ax.text(ax.get_xlim()[-1] + 0.1, loc, loc, ha="left", va="center")
stashfig("semipar-pvalues-by-dimension")

# #%%
# test_case = "rotation"
# embedding = "omnibus"
# n_components = 8
# n_bootstraps = 100
# n_repeats = 5
# rows = []
# for n_shuffle in [4, 8, 16]:

#     for repeat in range(n_repeats):
#         inds = np.arange(len(rr_adj))
#         choice_inds = np.random.choice(len(rr_adj), size=n_shuffle, replace=False)
#         shuffle_inds = choice_inds.copy()
#         np.random.shuffle(shuffle_inds)
#         inds[choice_inds] = inds[shuffle_inds]
#         rr_adj_shuffle = rr_adj[np.ix_(inds, inds)]
#         currtime = time.time()
#         pvalue, tstat, misc = latent_position_test(
#             ll_adj,
#             rr_adj_shuffle,
#             embedding=embedding,
#             n_components=n_components,
#             test_case=test_case,
#             n_bootstraps=n_bootstraps,
#         )
#         row = {
#             "pvalue": pvalue,
#             "tstat": tstat,
#             "n_shuffle": n_shuffle,
#             "n_components": n_components,
#             "n_bootstraps": n_bootstraps,
#             "embedding": embedding,
#             "test_case": test_case,
#             "repeat": repeat,
#         }
#         rows.append(row)
#         print(f"{time.time() - currtime:.3f} seconds elapsed.")
#         print(f"n_shuffle: {n_shuffle}")
#         print(f"test case: {test_case}")
#         print(f"embedding: {embedding}")
#         print(f"n_components: {n_components}")
#         print(f"p-value: {pvalue}")
#         print(f"tstat: {tstat}")
#         print()

# #%%
# results = pd.DataFrame(rows)
# fig, ax = plt.subplots(1, 1, figsize=(8, 6))
# sns.scatterplot(data=results, x="n_shuffle", y="pvalue", ax=ax)
# stashfig("shuffle-p-values")
End
elapsed = time.time() - t0
delta = datetime.timedelta(seconds=elapsed)
print("----")
print(f"Script took {delta}")
print(f"Completed at {datetime.datetime.now()}")
print("----")
----
Script took 0:00:02.892378
Completed at 2021-04-27 12:59:46.906761
----