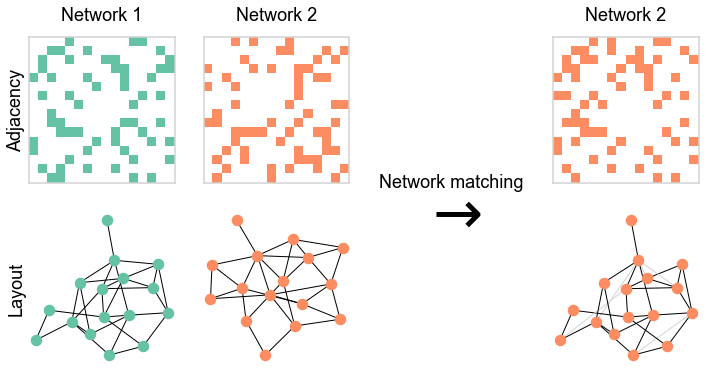
Node matching
Here we briefly explain the idea of using network (or graph) matching to uncover an alignment between the nodes of two networks.
Preliminaries
from networkx.classes.graph import Graph
from pkg.utils import set_warnings

import datetime
import pprint
import time

import matplotlib.pyplot as plt
import numpy as np
import pandas as pd
import seaborn as sns
from giskard.utils import get_paired_inds
from graspologic.align import OrthogonalProcrustes, SeedlessProcrustes
from graspologic.embed import AdjacencySpectralEmbed, select_dimension
from graspologic.utils import augment_diagonal, binarize, pass_to_ranks
from hyppo.ksample import KSample
from pkg.data import (
    load_maggot_graph,
    load_navis_neurons,
    load_network_palette,
    load_node_palette,
)
from pkg.io import savefig
from pkg.plot import set_theme
from sklearn.metrics.pairwise import cosine_similarity
from src.pymaid import start_instance
from src.visualization import simple_plot_neurons
from pkg.plot import set_theme
from graspologic.simulations import er_corr
import networkx as nx
from giskard.plot import merge_axes, soft_axis_off
from matplotlib.colors import ListedColormap
from graspologic.match import GraphMatch
from graspologic.plot import heatmap


def stashfig(name, **kwargs):
    foldername = "introduce_node_matching"
    savefig(name, foldername=foldername, **kwargs)


network_palette, NETWORK_KEY = load_network_palette()
t0 = time.time()
set_theme()
Illustrate graph matching on a simulated dataset
def set_light_border(ax):
    for side in ["left", "right", "top", "bottom"]:
        ax.spines[side].set_visible(True)
        ax.spines[side].set_linewidth(1.5)
        ax.spines[side].set_color("lightgrey")


# sample two networks
np.random.seed(88888)
A1, A2 = er_corr(16, 0.3, 0.9)

# set up the plot
heatmap_kws = dict(cbar=False, center=None)
fig, axs = plt.subplots(2, 4, figsize=(12, 6))

# plot graph 1 adjacency
ax = axs[0, 0]
colors = ["white", network_palette["Left"]]
cmap = ListedColormap(colors)
heatmap(A1, ax=ax, title="Network 1", cmap=cmap, **heatmap_kws)
set_light_border(ax)
ax.set_ylabel("Adjacency")

# plot graph 2 adjacency, with a random shuffling of the nodes
ax = axs[0, 1]
shuffle_inds = np.random.permutation(len(A2))
colors = ["white", network_palette["Right"]]
cmap = ListedColormap(colors)
heatmap(
    A2[shuffle_inds][:, shuffle_inds],
    ax=ax,
    title="Network 2",
    cmap=cmap,
    **heatmap_kws,
)
set_light_border(ax)

# create networkx graphs from the adjacencies
g1 = nx.from_numpy_array(A1)
g2 = nx.from_numpy_array(A2)

# plot the first graph as a ball-and-stick
ax = axs[1, 0]
pos = nx.kamada_kawai_layout(g1)
nx.draw_networkx(
    g1,
    with_labels=False,
    pos=pos,
    ax=ax,
    node_color=network_palette["Left"],
    node_size=100,
)
ax.axis("on")
soft_axis_off(ax)
ax.set_ylabel("Layout")

# plot the second graph as a ball-and-stick, with it's own predicted layout
ax = axs[1, 1]
nx.draw_kamada_kawai(g2, ax=ax, node_color=network_palette["Right"], node_size=100)

# draw an arrow in the middle of the plot
ax = merge_axes(fig, axs, rows=None, cols=2)
ax.axis("off")
text = "Network matching"
ax.text(
    0.5,
    0.55,
    text,
    ha="center",
    va="center",
)
text = r"$\rightarrow$"
ax.text(
    0.5,
    0.45,
    text,
    ha="center",
    va="center",
    fontsize=60,
)

# graph match to recover the pairing
gm = GraphMatch(n_init=30)
perm_inds = gm.fit_predict(A1, A2)
ax = axs[0, 3]
heatmap(A2[perm_inds][:, perm_inds], ax=ax, title="Network 2", cmap=cmap, **heatmap_kws)
set_light_border(ax)

# plot the second network after alignment, color edges based on matchedness
edge_colors = []
edgelist = []
for edge in g2.edges:
    edgelist.append(edge)
    if g1.has_edge(*edge):
        edge_colors.append("black")
    else:
        edge_colors.append("lightgrey")
ax = axs[1, 3]
nx.draw_networkx(
    g2,
    with_labels=False,
    pos=pos,
    ax=ax,
    node_color=network_palette["Right"],
    node_size=100,
    edgelist=edgelist,
    edge_color=edge_colors,
)

soft_axis_off(ax)
stashfig("network-matching-explanation")
*c* argument looks like a single numeric RGB or RGBA sequence, which should be avoided as value-mapping will have precedence in case its length matches with *x* & *y*.  Please use the *color* keyword-argument or provide a 2-D array with a single row if you intend to specify the same RGB or RGBA value for all points.
*c* argument looks like a single numeric RGB or RGBA sequence, which should be avoided as value-mapping will have precedence in case its length matches with *x* & *y*.  Please use the *color* keyword-argument or provide a 2-D array with a single row if you intend to specify the same RGB or RGBA value for all points.
*c* argument looks like a single numeric RGB or RGBA sequence, which should be avoided as value-mapping will have precedence in case its length matches with *x* & *y*.  Please use the *color* keyword-argument or provide a 2-D array with a single row if you intend to specify the same RGB or RGBA value for all points.
elapsed = time.time() - t0
delta = datetime.timedelta(seconds=elapsed)
print("----")
print(f"Script took {delta}")
print(f"Completed at {datetime.datetime.now()}")
print("----")
----
Script took 0:00:01.799971
Completed at 2021-05-12 14:46:36.165143
----