Look at RDPG models
Preliminaries
import datetime
import time

import matplotlib.pyplot as plt
import numpy as np
import seaborn as sns
from giskard.plot import graphplot
from graspologic.align import OrthogonalProcrustes, SeedlessProcrustes
from graspologic.embed import (
    AdjacencySpectralEmbed,
    OmnibusEmbed,
    select_dimension,
    selectSVD,
)
from graspologic.match import GraphMatch
from graspologic.plot import pairplot
from graspologic.utils import (
    augment_diagonal,
    binarize,
    multigraph_lcc_intersection,
    pass_to_ranks,
)
from matplotlib.collections import LineCollection
from pkg.data import load_maggot_graph, load_palette
from pkg.io import savefig
from pkg.plot import set_theme

from pkg.utils import set_warnings
from sklearn.preprocessing import normalize
from src.visualization import adjplot
from src.visualization import CLASS_COLOR_DICT
from umap import AlignedUMAP
from factor_analyzer import Rotator
from src.visualization import matrixplot
from matplotlib.colors import Normalize, SymLogNorm
from matplotlib import cm
from giskard.utils import get_paired_inds

t0 = time.time()


def stashfig(name, **kwargs):
    foldername = "look_at_it_rdpg"
    savefig(name, foldername=foldername, **kwargs)


colors = sns.color_palette("Set2")

palette = dict(zip(["Left", "Right"], [colors[0], colors[1]]))
set_theme()
/Users/bpedigo/miniconda3/envs/maggot-revamp/lib/python3.8/site-packages/umap/__init__.py:9: UserWarning: Tensorflow not installed; ParametricUMAP will be unavailable
  warn("Tensorflow not installed; ParametricUMAP will be unavailable")
Load and process data
CLASS_KEY = "merge_class"
node_palette = CLASS_COLOR_DICT
mg = load_maggot_graph()
mg = mg[mg.nodes["paper_clustered_neurons"] | mg.nodes["accessory_neurons"]]
mg = mg[mg.nodes["hemisphere"].isin(["L", "R"])]
mg.to_largest_connected_component(verbose=True)
out_degrees = np.count_nonzero(mg.sum.adj, axis=0)
in_degrees = np.count_nonzero(mg.sum.adj, axis=1)
max_in_out_degree = np.maximum(out_degrees, in_degrees)
# TODO ideally we would OOS these back in?
keep_inds = np.arange(len(mg.nodes))[max_in_out_degree > 2]
remove_ids = np.setdiff1d(mg.nodes.index, mg.nodes.index[keep_inds])
print(f"Removed {len(remove_ids)} nodes when removing pendants.")
mg.nodes = mg.nodes.iloc[keep_inds]
mg.g.remove_nodes_from(remove_ids)
mg.to_largest_connected_component(verbose=True)
mg.nodes.sort_values("hemisphere", inplace=True)
mg.nodes["_inds"] = range(len(mg.nodes))
nodes = mg.nodes

raw_adj = mg.sum.adj.copy()

left_nodes = mg.nodes[mg.nodes["hemisphere"] == "L"]
left_inds = left_nodes["_inds"]
right_nodes = mg.nodes[mg.nodes["hemisphere"] == "R"]
right_inds = right_nodes["_inds"]

left_paired_inds, right_paired_inds = get_paired_inds(
    mg.nodes, pair_key="predicted_pair", pair_id_key="predicted_pair_id"
)
right_paired_inds_shifted = right_paired_inds - len(left_inds)
Removed 13 nodes when taking the largest connected component.
Removed 38 nodes when removing pendants.
Removed 0 nodes when taking the largest connected component.
Embed the network using adjacency spectral embedding
def preprocess_for_embed(ll_adj, rr_adj, preprocess):
    if "binarize" in preprocess:
        ll_adj_to_embed = binarize(ll_adj)
        rr_adj_to_embed = binarize(rr_adj)

    if "rescale" in preprocess:
        ll_norm = np.linalg.norm(ll_adj_to_embed, ord="fro")
        rr_norm = np.linalg.norm(rr_adj_to_embed, ord="fro")
        mean_norm = (ll_norm + rr_norm) / 2
        ll_adj_to_embed *= mean_norm / ll_norm
        rr_adj_to_embed *= mean_norm / rr_norm
    return ll_adj_to_embed, rr_adj_to_embed


def embed(adj, n_components=40, ptr=False):
    if ptr:
        adj = pass_to_ranks(adj)
    elbow_inds, elbow_vals = select_dimension(augment_diagonal(adj), n_elbows=5)
    elbow_inds = np.array(elbow_inds)
    ase = AdjacencySpectralEmbed(n_components=n_components)
    out_latent, in_latent = ase.fit_transform(adj)
    return out_latent, in_latent, ase.singular_values_, elbow_inds


def split_adj(adj):
    ll_adj = adj[np.ix_(left_inds, left_inds)]
    rr_adj = adj[np.ix_(right_inds, right_inds)]
    lr_adj = adj[np.ix_(left_inds, right_inds)]
    rl_adj = adj[np.ix_(right_inds, left_inds)]
    return ll_adj, rr_adj, lr_adj, rl_adj


def prescale_for_embed(adjs):
    norms = [np.linalg.norm(adj, ord="fro") for adj in adjs]
    mean_norm = np.mean(norms)
    adjs = [adjs[i] * mean_norm / norms[i] for i in range(len(adjs))]
    return adjs


def ase(adj, n_components=None):
    U, S, Vt = selectSVD(adj, n_components=n_components, algorithm="full")
    S_sqrt = np.diag(np.sqrt(S))
    X = U @ S_sqrt
    Y = Vt.T @ S_sqrt
    return X, Y


max_n_components = 40
preprocess = ["binarize", "rescale"]


ll_adj, rr_adj, _, _ = split_adj(raw_adj)

ll_adj_to_embed, rr_adj_to_embed = preprocess_for_embed(ll_adj, rr_adj, preprocess)

X_ll, Y_ll, left_sing_vals, left_elbow_inds = embed(
    ll_adj_to_embed, n_components=max_n_components
)
X_rr, Y_rr, right_sing_vals, right_elbow_inds = embed(
    rr_adj_to_embed, n_components=max_n_components
)
/Users/bpedigo/JHU_code/maggot/graspologic/graspologic/embed/ase.py:166: UserWarning:

Input graph is not fully connected. Results may notbe optimal. You can compute the largest connected component byusing ``graspologic.utils.largest_connected_component``.
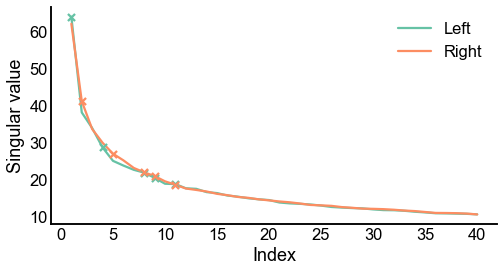
Plot screeplots
def screeplot(sing_vals, elbow_inds, color=None, ax=None, label=None):
    if ax is None:
        _, ax = plt.subplots(1, 1, figsize=(8, 4))
    plt.plot(range(1, len(sing_vals) + 1), sing_vals, color=color, label=label)
    plt.scatter(
        elbow_inds, sing_vals[elbow_inds - 1], marker="x", s=50, zorder=10, color=color
    )
    ax.set(ylabel="Singular value", xlabel="Index")
    return ax


fig, ax = plt.subplots(1, 1, figsize=(8, 4))
screeplot(left_sing_vals, left_elbow_inds, color=palette["Left"], ax=ax, label="Left")
screeplot(
    right_sing_vals, right_elbow_inds, color=palette["Right"], ax=ax, label="Right"
)
ax.legend()
stashfig(f"screeplot")
Align the left and the right embeddings
def joint_procrustes(
    data1,
    data2,
    method="orthogonal",
    paired_inds1=None,
    paired_inds2=None,
    swap=False,
    verbose=False,
):
    n = len(data1[0])
    if method == "orthogonal":
        procruster = OrthogonalProcrustes()
    elif method == "seedless":
        procruster = SeedlessProcrustes(init="sign_flips")
    elif method == "seedless-oracle":
        X1_paired = data1[0][paired_inds1, :]
        X2_paired = data2[0][paired_inds2, :]
        if swap:
            Y1_paired = data1[1][paired_inds2, :]
            Y2_paired = data2[1][paired_inds1, :]
        else:
            Y1_paired = data1[1][paired_inds1, :]
            Y2_paired = data2[1][paired_inds2, :]
        data1_paired = np.concatenate((X1_paired, Y1_paired), axis=0)
        data2_paired = np.concatenate((X2_paired, Y2_paired), axis=0)
        op = OrthogonalProcrustes()
        op.fit(data1_paired, data2_paired)
        procruster = SeedlessProcrustes(
            init="custom",
            initial_Q=op.Q_,
            optimal_transport_eps=1.0,
            optimal_transport_num_reps=100,
            iterative_num_reps=10,
        )
    data1 = np.concatenate(data1, axis=0)
    data2 = np.concatenate(data2, axis=0)
    currtime = time.time()
    data1_mapped = procruster.fit_transform(data1, data2)
    if verbose > 1:
        print(f"{time.time() - currtime:.3f} seconds elapsed for SeedlessProcrustes.")
    data1 = (data1_mapped[:n], data1_mapped[n:])
    return data1


def ase(adj, n_components=None):
    U, S, Vt = selectSVD(adj, n_components=n_components, algorithm="full")
    S_sqrt = np.diag(np.sqrt(S))
    X = U @ S_sqrt
    Y = Vt.T @ S_sqrt
    return X, Y


n_align_components = 32

X_ll = X_ll[:, :n_align_components]
Y_ll = Y_ll[:, :n_align_components]
X_rr = X_rr[:, :n_align_components]
Y_rr = Y_rr[:, :n_align_components]

X_ll, Y_ll = joint_procrustes(
    (X_ll, Y_ll),
    (X_rr, Y_rr),
    method="seedless-oracle",
    paired_inds1=left_paired_inds,
    paired_inds2=right_paired_inds_shifted,
)

XY_ll = np.concatenate((X_ll, Y_ll), axis=1)
XY_rr = np.concatenate((X_rr, Y_rr), axis=1)
n_final_components = 20
Z_ll, _ = ase(XY_ll, n_components=n_final_components)
Z_rr, _ = ase(XY_rr, n_components=n_final_components)
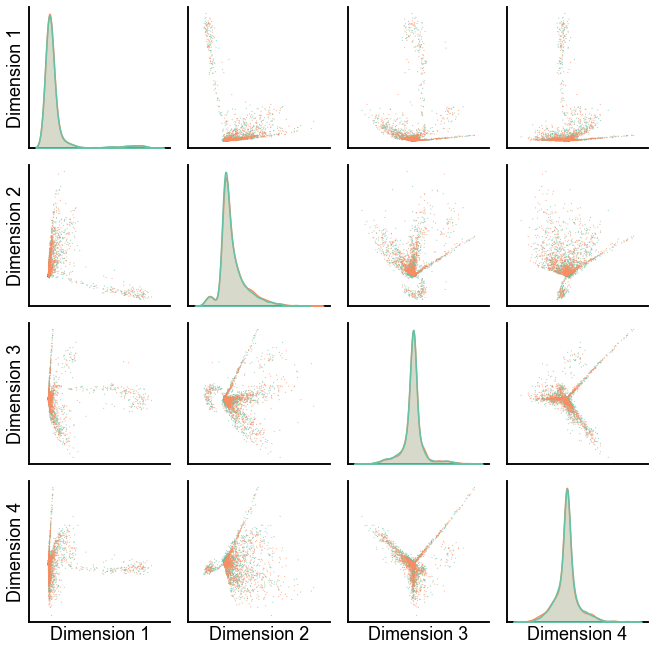
Plot the left and the right embeddings in the same space after the alignment
def add_connections(x1, x2, y1, y2, color="black", alpha=0.2, linewidth=0.2, ax=None):
    x1 = np.array(x1)
    x2 = np.array(x2)
    y1 = np.array(y1)
    y2 = np.array(y2)
    if ax is None:
        ax = plt.gca()

    coords = []
    for i in range(len(x1)):
        coords.append([[x1[i], y1[i]], [x2[i], y2[i]]])
    lc = LineCollection(
        coords,
        colors=color,
        linewidths=linewidth,
        alpha=alpha,
        zorder=0,
    )
    ax.add_collection(lc)


def plot_latents(
    left,
    right,
    title="",
    n_show=4,
    alpha=0.3,
    linewidth=0.4,
    connections=False,
    palette=None,
):
    if n_show > left.shape[1]:
        n_show = left.shape[1]
    plot_data = np.concatenate([left, right], axis=0)
    labels = np.array(["Left"] * len(left) + ["Right"] * len(right))
    pg = pairplot(
        plot_data[:, :n_show], labels=labels, title=title, size=5, palette=palette
    )
    if connections:
        axs = pg.axes
        for i in range(n_show):
            for j in range(n_show):
                if i != j:
                    ax = axs[i, j]
                    add_connections(
                        left[:, j],
                        right[:, j],
                        left[:, i],
                        right[:, i],
                        ax=ax,
                        alpha=alpha,
                        linewidth=linewidth,
                    )
    pg._legend.remove()
    return pg


plot_latents(X_ll, X_rr, palette=palette, connections=False)
<seaborn.axisgrid.PairGrid at 0x7ff0c2708940>
Examine the models
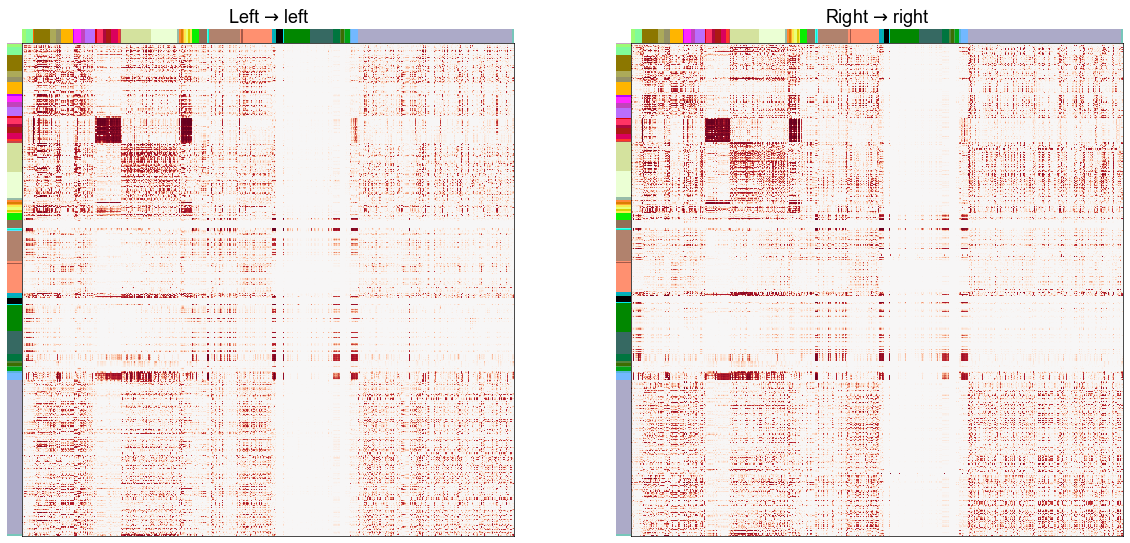
Plot the RDPG \(\hat{P}\) for the left and the right hemispheres
vmin = -1
vmax = 1
cmap = cm.get_cmap("RdBu_r")
norm = Normalize(vmin, vmax)
norm = SymLogNorm(linthresh=0.1, linscale=2, vmin=vmin, vmax=vmax, base=10)


n_components = 16
P_ll = X_ll[:, :n_components] @ Y_ll[:, :n_components].T
P_ll[P_ll < 0] = 0
P_rr = X_rr[:, :n_components] @ Y_rr[:, :n_components].T
P_rr[P_rr < 0] = 0

adjplot_kws = dict(
    colors="merge_class",
    palette=CLASS_COLOR_DICT,
    cmap=cmap,
    norm=norm,
    center=0,
    vmin=vmin,
    vmax=vmax,
    item_order="merge_class",
    cbar=False,
)
fig, axs = plt.subplots(1, 2, figsize=(20, 10))
ax = axs[0]
adjplot(P_ll, meta=left_nodes, ax=ax, title=r"Left $\to$ left", **adjplot_kws)
ax = axs[1]
adjplot(P_rr, meta=right_nodes, ax=ax, title=r"Right $\to$ right", **adjplot_kws)
stashfig("phat-comparison")
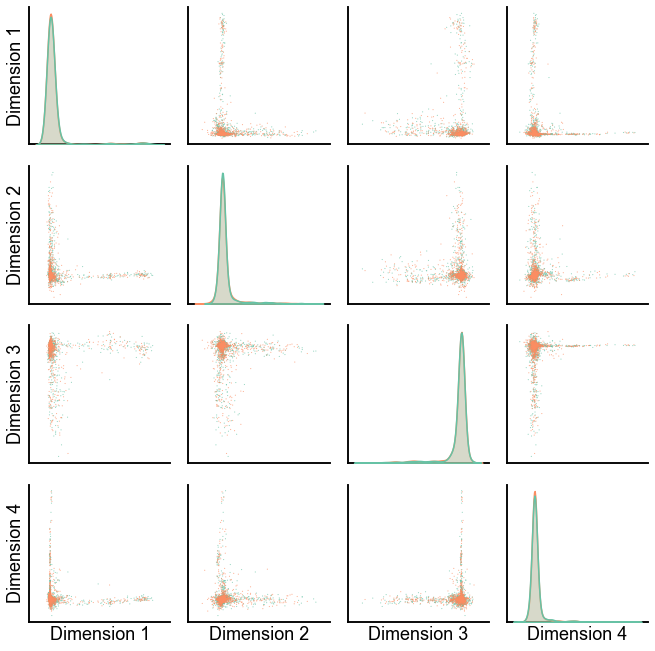
Experimental: try to make sense of the individual components
n_components = 20


def varimax(X):
    return Rotator(normalize=False).fit_transform(X)


n_left = len(X_ll)
X_concat = np.concatenate((X_ll[:, :n_components], X_rr[:, :n_components]), axis=0)

X_concat = varimax(X_concat)
X_ll_varimax = X_concat[:n_left]
X_rr_varimax = X_concat[n_left:]
plot_latents(X_ll_varimax, X_rr_varimax, palette=palette)

XY_rr = np.concatenate((X_rr[:, :n_components], Y_rr[:, :n_components]), axis=0)
XY_rr_varimax = varimax(XY_rr)

X_rr_varimax = XY_rr_varimax[: len(X_rr)]
Y_rr_varimax = XY_rr_varimax[len(X_rr) :]
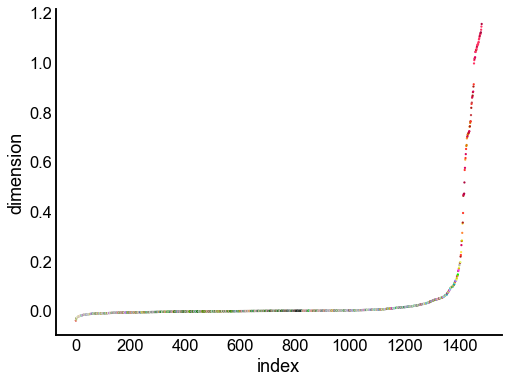
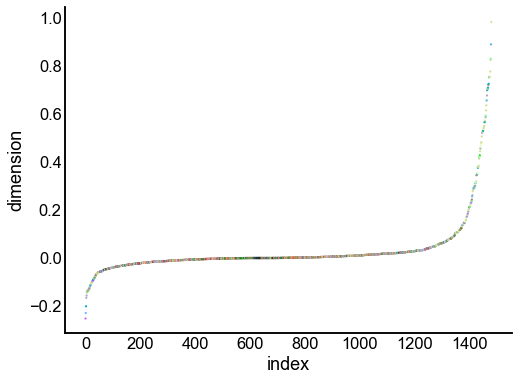
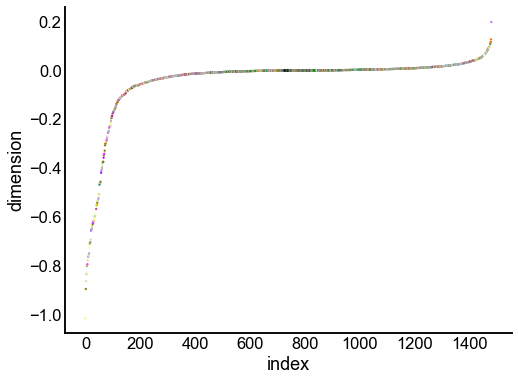
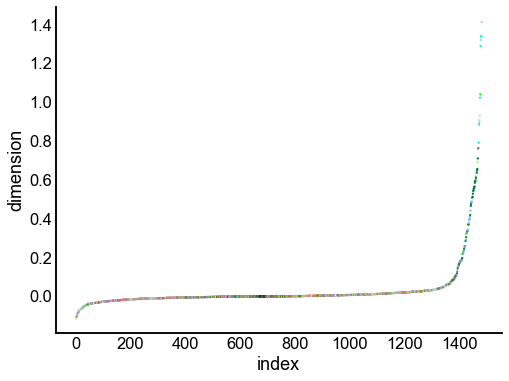
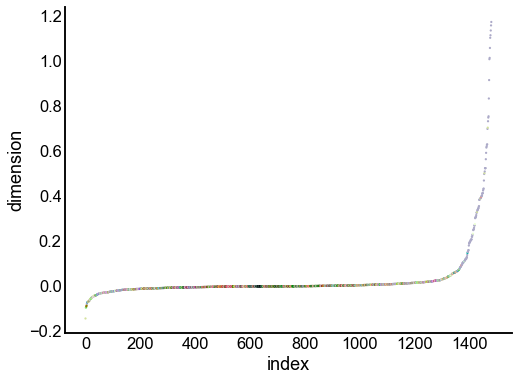
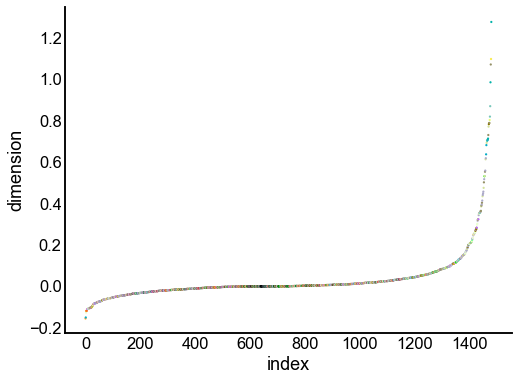
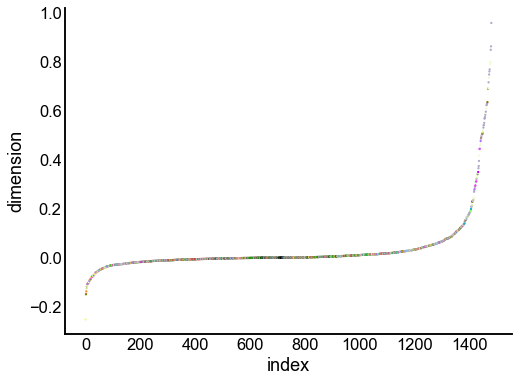
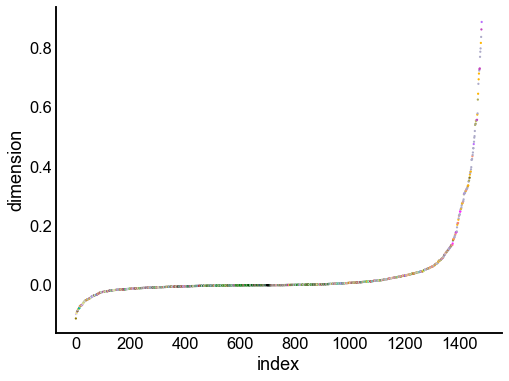
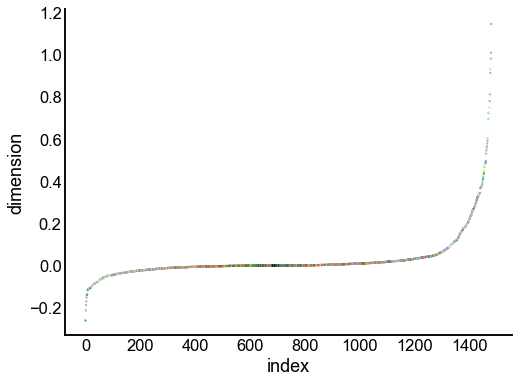
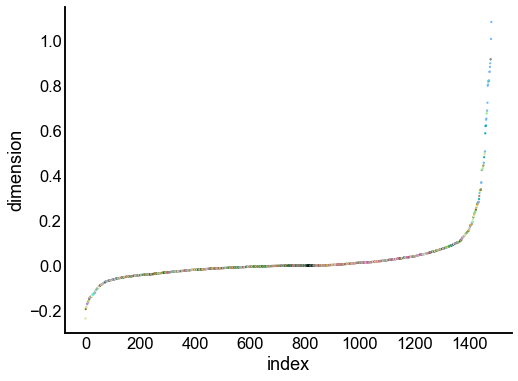
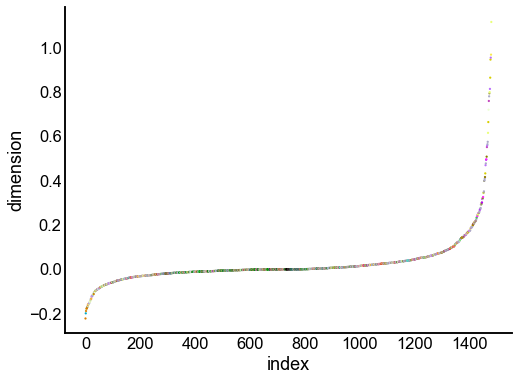
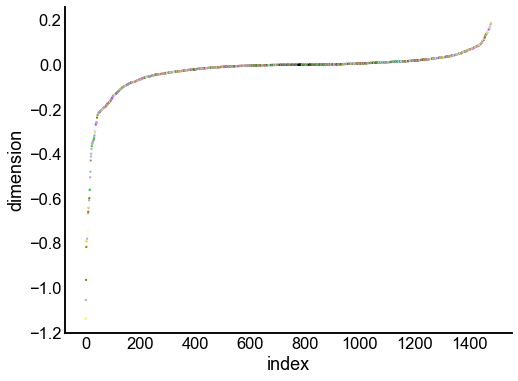
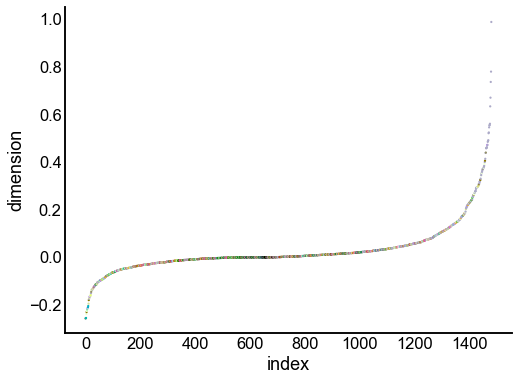
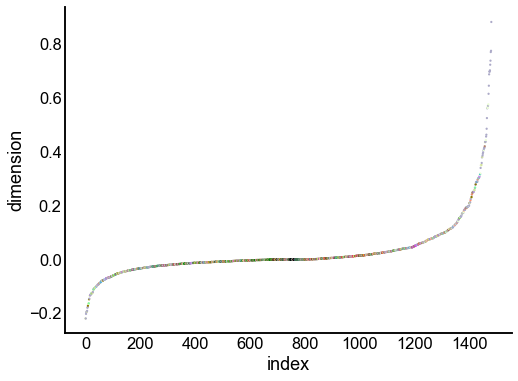
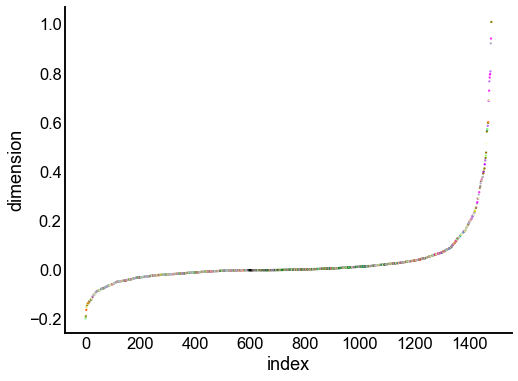
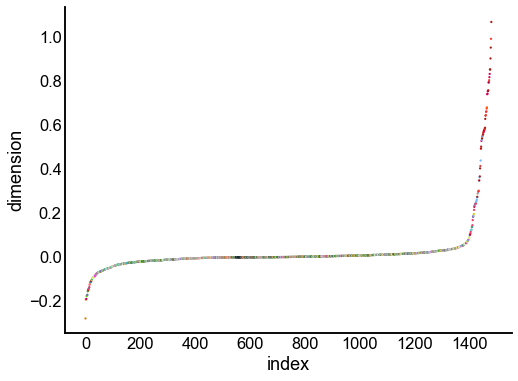
Just for the right, examine the individual components
for dimension in X_rr_varimax.T[:16]:
    nodes = right_nodes.copy()
    nodes["dimension"] = dimension
    nodes.sort_values("dimension", inplace=True)
    nodes["index"] = np.arange(len(nodes))
    fig, ax = plt.subplots(1, 1, figsize=(8, 6))
    sns.scatterplot(
        data=nodes,
        x="index",
        y="dimension",
        hue="merge_class",
        palette=CLASS_COLOR_DICT,
        legend=False,
        linewidth=0,
        s=5,
    )
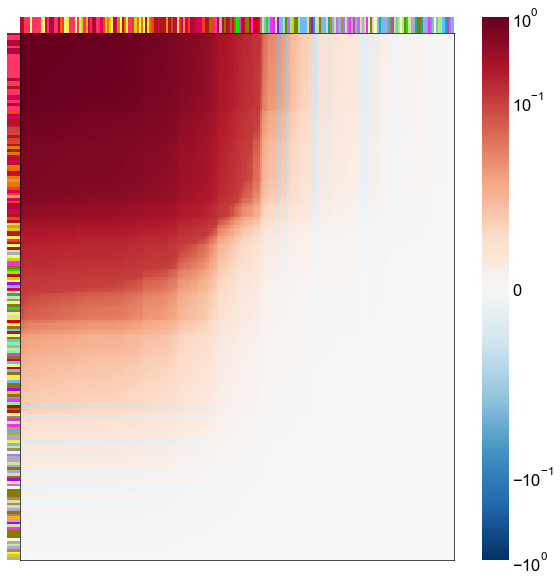
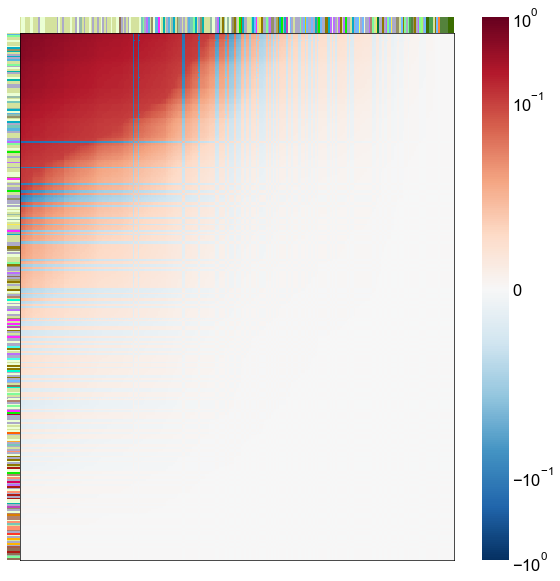
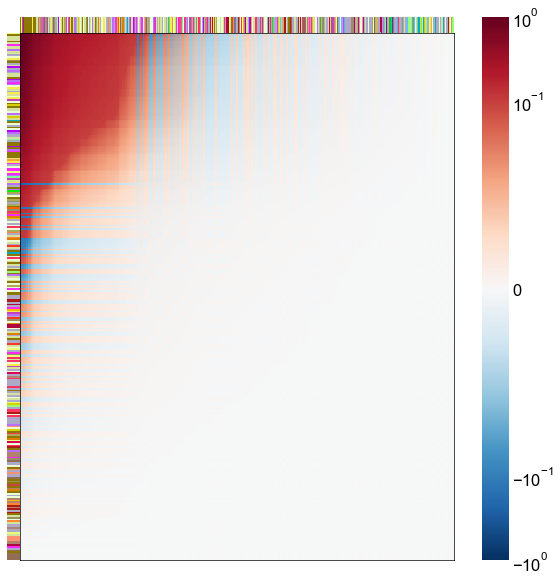
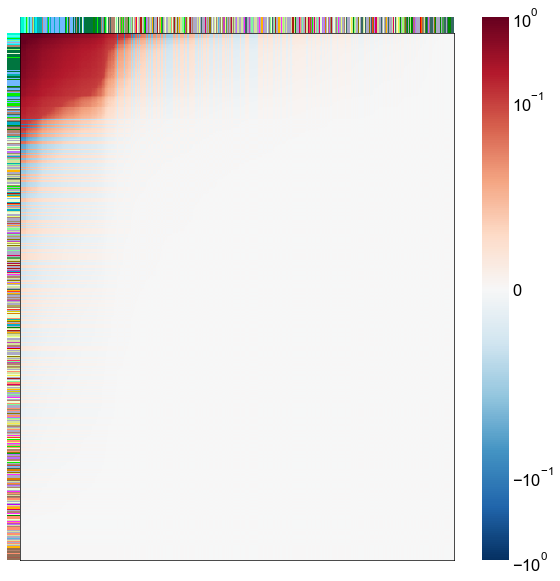
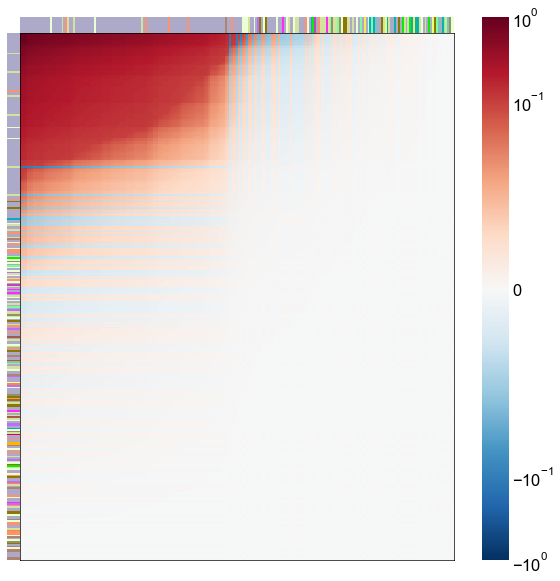
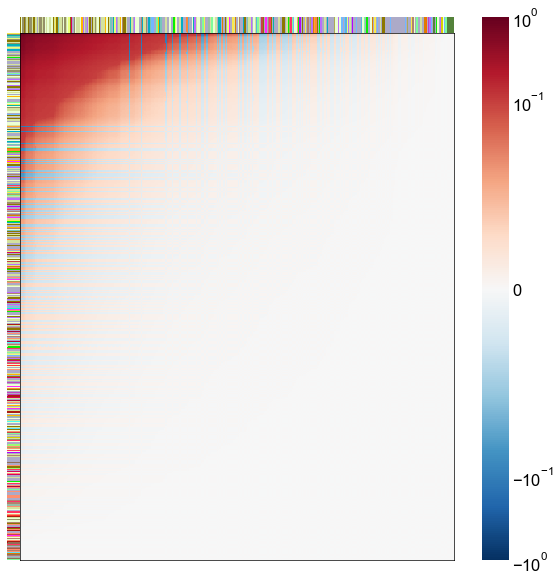
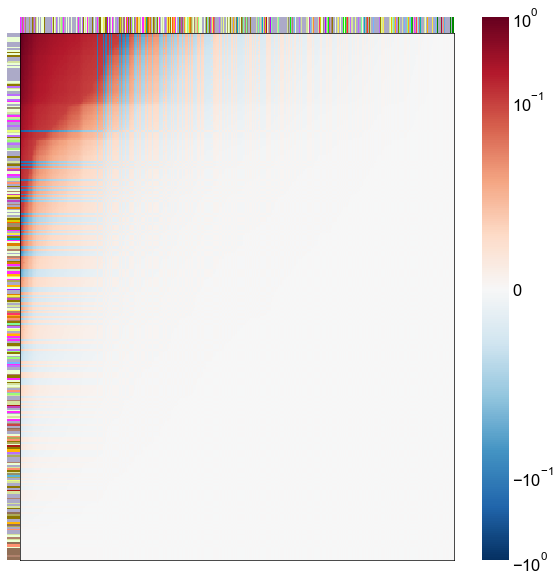
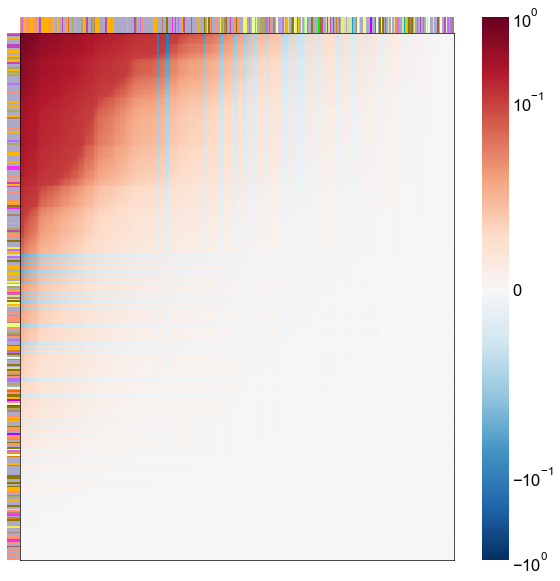
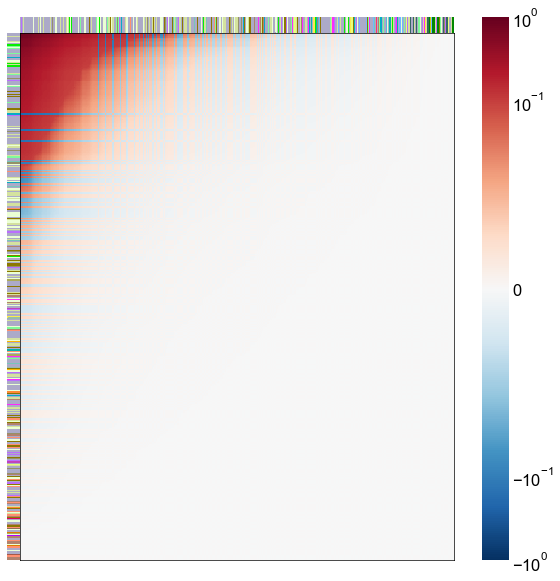
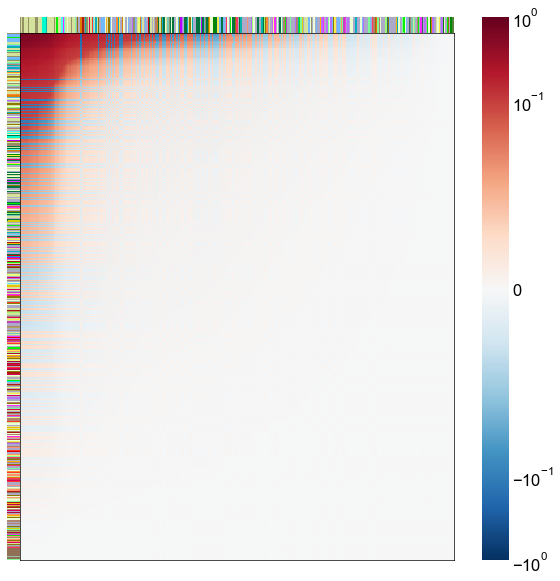
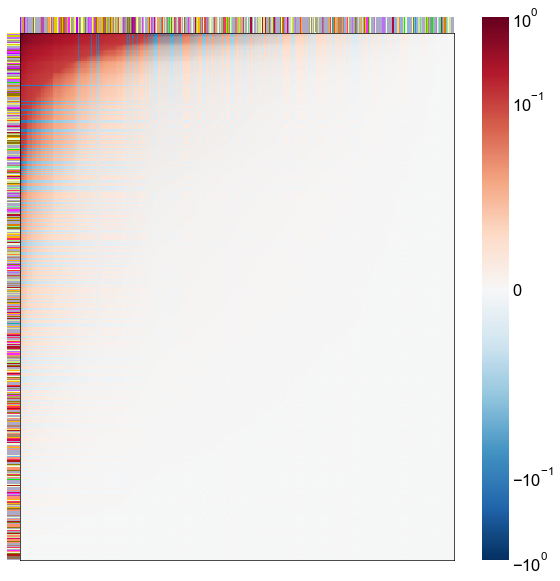
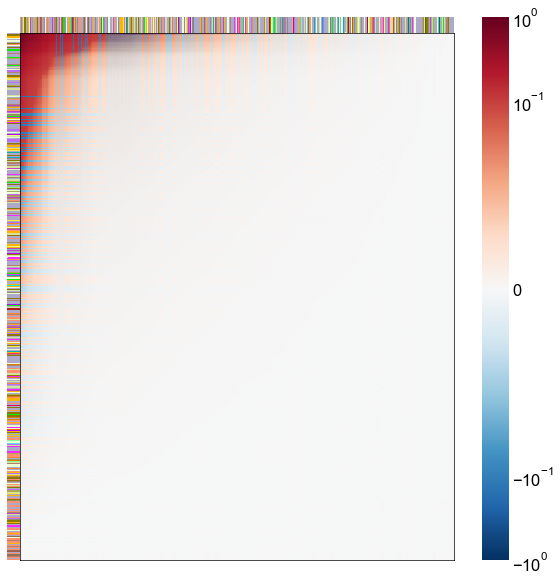
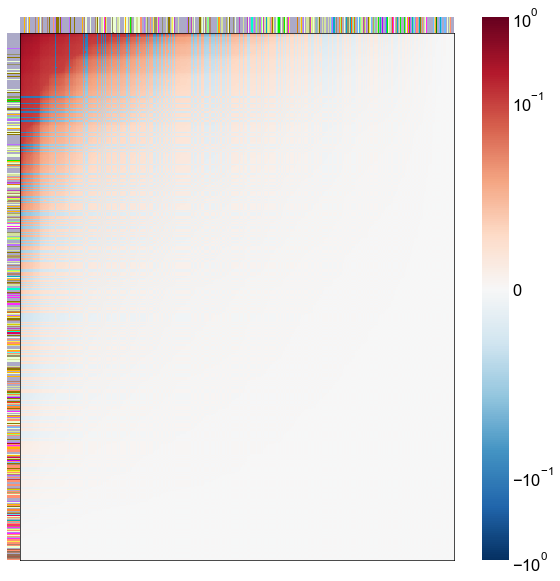
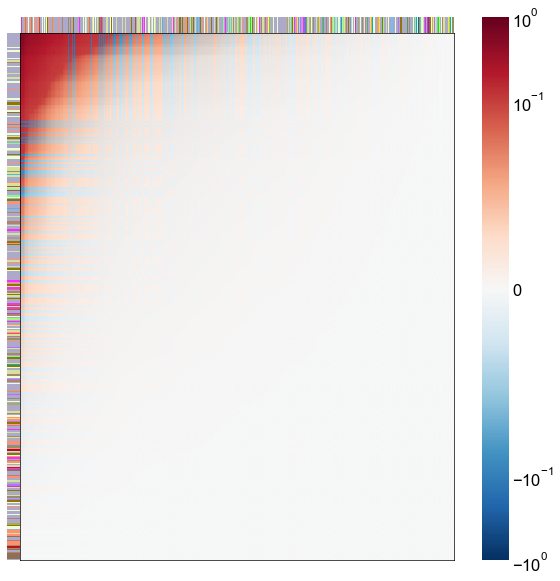
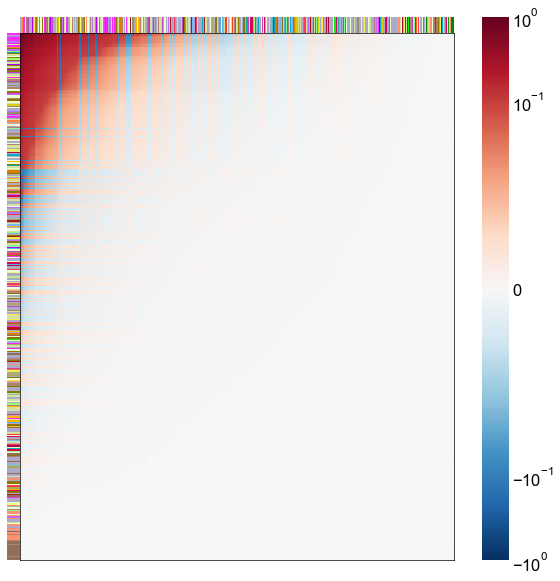
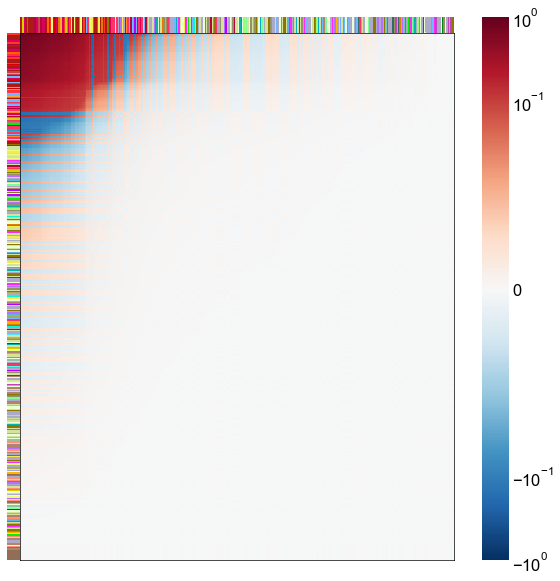
Look at what the components mean in the probability space
nodes = right_nodes.copy()
alpha = 10
quantile = 0.99
for i in range(16):
    x = X_rr_varimax[:, i]
    y = Y_rr_varimax[:, i]
    Phat = x[:, None] @ y[:, None].T
    abs_Phat = np.abs(Phat)
    q = np.quantile(abs_Phat, quantile)
    mask = abs_Phat > q
    row_used = mask.any(axis=0)
    col_used = mask.any(axis=1)
    col_nodes = nodes.iloc[col_used].copy()
    row_nodes = nodes.iloc[row_used].copy()
    sub_Phat = Phat[row_used][:, col_used]
    expected_out_degree = np.sum(np.abs(sub_Phat), axis=1)
    expected_in_degree = np.sum(np.abs(sub_Phat), axis=0)
    row_nodes["expected_out_degree"] = -expected_out_degree
    col_nodes["expected_in_degree"] = -expected_in_degree
    matrixplot(
        sub_Phat,
        row_meta=row_nodes,
        col_meta=col_nodes,
        row_colors="merge_class",
        col_colors="merge_class",
        row_palette=CLASS_COLOR_DICT,
        col_palette=CLASS_COLOR_DICT,
        row_item_order="expected_out_degree",
        col_item_order="expected_in_degree",
        cmap=cmap,
        norm=norm,
        center=0,
        vmin=vmin,
        vmax=vmax,
    )
    stashfig(f"right-phat-component-{i}")
elapsed = time.time() - t0
delta = datetime.timedelta(seconds=elapsed)
print("----")
print(f"Script took {delta}")
print(f"Completed at {datetime.datetime.now()}")
print("----")
----
Script took 0:02:10.024765
Completed at 2021-05-10 17:35:29.526520
----