A density-based test#
Here, we compare the two matched networks by treating each as an Erdos-Renyi network.
Show code cell source
from pkg.utils import set_warnings

set_warnings()

import datetime
import time

import matplotlib.pyplot as plt
import numpy as np
import seaborn as sns
from giskard.plot import rotate_labels
from myst_nb import glue as default_glue
from pkg.data import load_matched, load_network_palette, load_node_palette
from pkg.io import savefig
from pkg.plot import set_theme
from pkg.stats import erdos_renyi_test_paired

DISPLAY_FIGS = False
FILENAME = "er_matched_test"

rng = np.random.default_rng(8888)


def gluefig(name, fig, **kwargs):
    savefig(name, foldername=FILENAME, **kwargs)

    glue(name, fig, prefix="fig")

    if not DISPLAY_FIGS:
        plt.close()


def glue(name, var, prefix=None):
    savename = f"{FILENAME}-{name}"
    if prefix is not None:
        savename = prefix + ":" + savename
    default_glue(savename, var, display=False)


t0 = time.time()
set_theme(font_scale=1.25)

network_palette, NETWORK_KEY = load_network_palette()
node_palette, NODE_KEY = load_node_palette()


left_adj, left_nodes = load_matched("left")
right_adj, right_nodes = load_matched("right")
Show code cell source
stat, pvalue, misc = erdos_renyi_test_paired(left_adj, right_adj)
glue("pvalue", pvalue)

n_no_edge = misc["neither"]
n_both_edge = misc["both"]
n_only_left = misc["only1"]
n_only_right = misc["only2"]
glue("n_no_edge", n_no_edge)
glue("n_both_edge", n_both_edge)
glue("n_only_left", n_only_left)
glue("n_only_right", n_only_right)
Show code cell source
# REF: https://matplotlib.org/stable/gallery/subplots_axes_and_figures/broken_axis.html
fig, axs = plt.subplots(
    2,
    1,
    figsize=(8, 8),
    sharex=True,
    gridspec_kw=dict(hspace=0.05, height_ratios=[1, 2]),
)

neutral_color = sns.color_palette("Set2")[2]
empty_color = sns.color_palette("Set2")[7]


def plot_bar(x, height, color=None, ax=None, text=True):
    ax.bar(x, height, color=color)
    if text:
        ax.text(x, height, f"{height:,}", color=color, ha="center", va="bottom")


lower_ymax = max(n_both_edge, n_only_left, n_only_right)

ax = axs[0]
plot_bar(0, n_both_edge, color=neutral_color, ax=ax, text=False)
plot_bar(1, n_only_left, color=network_palette["Left"], ax=ax, text=False)
plot_bar(2, n_only_right, color=network_palette["Right"], ax=ax, text=False)
plot_bar(3, n_no_edge, color=empty_color, ax=ax)
ax.set_ylim(n_no_edge * 0.9, n_no_edge * 1.1)
ax.spines.bottom.set_visible(False)
ax.set_yticks([1_500_000])
ax.set_yticklabels(["1.5e6"])


ax = axs[1]
plot_bar(0, n_both_edge, color=neutral_color, ax=ax)
plot_bar(1, n_only_left, color=network_palette["Left"], ax=ax)
plot_bar(2, n_only_right, color=network_palette["Right"], ax=ax)
plot_bar(3, n_no_edge, color=empty_color, ax=ax, text=False)
ax.set_xticks([0, 1, 2, 3])
ax.set_xticklabels(["Edge in\nboth", "Left edge\nonly", "Right edge\nonly", "No edge"])
rotate_labels(ax)
ax.set_ylim(0, lower_ymax * 1.05)

ax.set_yticks([15000])
ax.set_yticklabels(["1.5e4"])

d = 0.5  # proportion of vertical to horizontal extent of the slanted line
kwargs = dict(
    marker=[(-1, -d), (1, d)],
    markersize=12,
    linestyle="none",
    color="k",
    mec="k",
    mew=1,
    clip_on=False,
)
axs[0].plot([0, 1], [0, 0], transform=axs[0].transAxes, **kwargs)
axs[1].plot([0, 1], [1, 1], transform=axs[1].transAxes, **kwargs)

gluefig("edge_count_bars", fig)
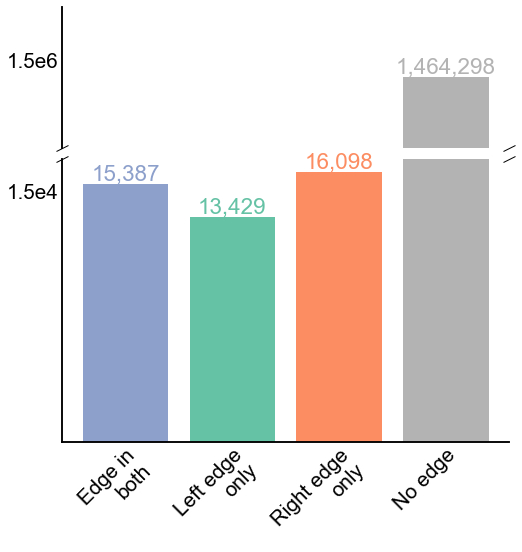
Fig. 13 The number of edges in each of the four possible categories for the 2x2 paired contingency table comparing paired edges. P-value for the McNemar’s test comparing the left and right paired edge counts is 1.94e-54. Note that McNemar’s test only compares the disagreeing edge counts, “Left edge only” and “Right edge only”.#
Show code cell source
elapsed = time.time() - t0
delta = datetime.timedelta(seconds=elapsed)
print(f"Script took {delta}")
print(f"Completed at {datetime.datetime.now()}")
Script took 0:00:01.415453
Completed at 2021-11-10 11:28:38.358462