treeple.datasets.make_trunk_classification#
- treeple.datasets.make_trunk_classification(n_samples, n_dim=4096, n_informative=256, mu_0=0, mu_1=1, rho=0, band_type='ma', return_params=False, scaling_factor=1.0, seed=None)[source]#
Generate trunk binary classification dataset.
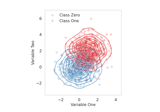
For each dimension in the first distribution, there is a mean of \(1 / d\), where
dis the dimensionality. The covariance is the identity matrix. The second distribution has a mean vector that is the negative of the first. Asdincreases, the two distributions become closer and closer.Full details for the trunk simulation can be found in [1].
Instead of the identity covariance matrix, one can implement a banded covariance matrix that follows [2].
- Parameters:
- n_samples
int Number of sample to generate. Must be an even number, else the total number of samples generated will be
n_samples - 1.- n_dim
int, optional The dimensionality of the dataset and the number of unique labels, by default 4096.
- n_informative
int, optional The informative dimensions. All others for
n_dim - n_informativeare Gaussian noise. Default is 256.- mu_0
int, optional The mean of the first distribution. By default -1. The mean of the distribution will decrease by a factor of
sqrt(i)for each dimensioni.- mu_1
int, optional The mean of the second distribution. By default 1. The mean of the distribution will decrease by a factor of
sqrt(i)for each dimensioni.- rho
float, optional The covariance value of the bands. By default 0 indicating, an identity matrix is used.
- band_type
str The band type to use. For details, see Example 1 and 2 in [2]. Either ‘ma’, or ‘ar’.
- return_params
bool, optional Whether or not to return the distribution parameters of the classes normal distributions. Default false.
- scaling_factor
float, optional The scaling factor for the covariance matrix. By default 1.
- seed
int, optional Random seed, by default None.
- n_samples
- Returns:
- X
np.ndarrayof shape (n_samples, n_dim), dtype=np.float64 Trunk dataset as a dense array.
- y
np.ndarrayof shape (n_samples,), dtype=np.intp Labels of the dataset.
- means
listof ArrayLike of shape (n_dim,), dtype=np.float64 The mean vector for each class starting with class 0. Returned if
return_paramsis True.- covs
listof ArrayLike of shape (n_dim, n_dim), dtype=np.float64 The covariance for each class. Returned if
return_paramsis True.
- X
Notes
Trunk: The trunk simulation decreases the signal-to-noise ratio as the dimensionality increases. This is implemented by decreasing the mean of the distribution by a factor of
sqrt(i)for each dimensioni. Thus for instance if the means of distribution one and two are 1 and -1 respectively, the means for the first dimension will be 1 and -1, for the second dimension will be 1/sqrt(2) and -1/sqrt(2), and so on.Trunk Overlap: The trunk overlap simulation generates two classes of data with the same covariance matrix and mean vector of zeros.
Covariance: The covariance matrix among different dimensions is controlled by the
rhoparameter and theband_typeparameter. Theband_typeparameter controls the type of band to use, while therhoparameter controls the specific scaling factor for the covariance matrix while going from one dimension to the next.References
