import pandas as pd
import graspologic as gp
import seaborn as sns
import hyppo
import matplotlib.pyplot as plt
import numpy as np

import plotly.graph_objects as go
import matplotlib.cm

from sklearn.preprocessing import LabelEncoder

from graspologic.embed import OmnibusEmbed, select_svd

import plotly.io as pio
pio.renderers.default="png"
## Read the data
key = pd.read_csv('../data/processed/key.csv')
data = pd.read_csv('../data/processed/mouses-volumes.csv')
fa = pd.read_csv('../data/processed/mouses-fa.csv')
data.set_index(key.DWI, inplace=True)
fa.set_index(key.DWI, inplace=True)
genotypes = ['APOE22', 'APOE33', 'APOE44']
gen_animals = {genotype: None for genotype in genotypes}
for genotype in genotypes:
gen_animals[genotype] = key.loc[key['Genotype'] == genotype]['DWI'].tolist()
vol_dat = {genotype: [] for genotype in genotypes}
fa_dat = {genotype: [] for genotype in genotypes}
for genotype in genotypes:
vol_dat[genotype] = data.loc[gen_animals[genotype]].to_numpy()
fa_dat[genotype] = fa.loc[gen_animals[genotype]].to_numpy()
## Compute correlations
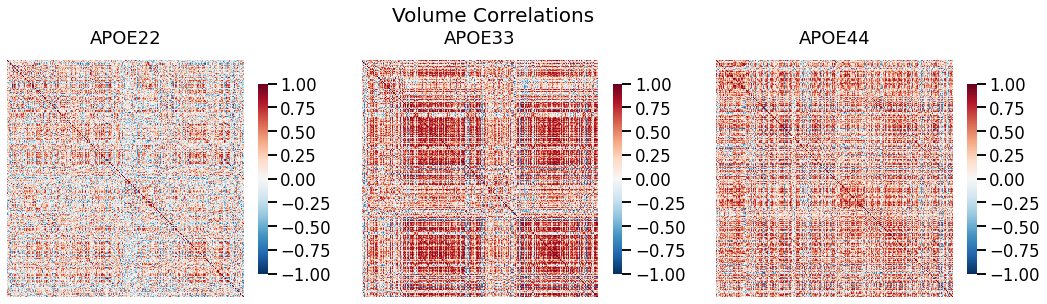
vol_cor = {genotype: gp.utils.symmetrize(np.corrcoef(dat, rowvar=False)) for (genotype, dat) in vol_dat.items()}
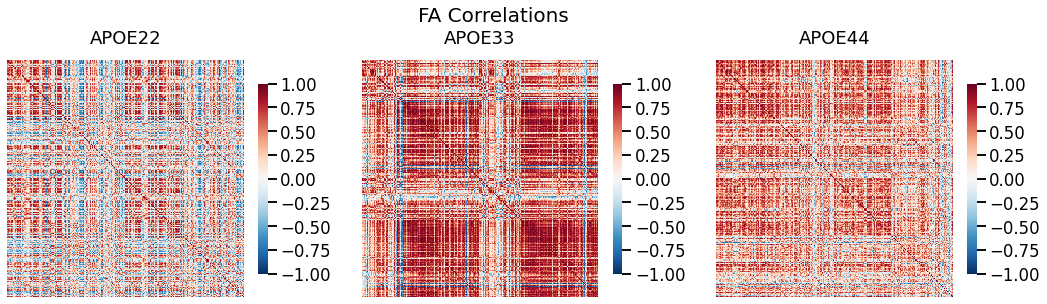
fa_cor = {genotype: gp.utils.symmetrize(np.corrcoef(dat, rowvar=False)) for (genotype, dat) in fa_dat.items()}
## Plot to make sure nothing is wrong
fig, ax = plt.subplots(1, 3, figsize=(18, 5))
for (i, genotype) in enumerate(vol_cor.keys()):
fig.suptitle("Volume Correlations", fontsize=20)
gp.plot.heatmap(vol_cor[genotype], title=genotype, ax=ax[i], vmin=-1, vmax=1)
fig, ax = plt.subplots(1, 3, figsize=(18, 5))
for (i, genotype) in enumerate(fa_cor.keys()):
fig.suptitle("FA Correlations", fontsize=20)
gp.plot.heatmap(fa_cor[genotype], title=genotype, ax=ax[i], vmin=-1, vmax=1)
## Node hierarchical label data
node_labels = pd.read_csv("../data/processed/node_label_dictionary.csv")
Test whether brain volume and FA are independent#
If FA and brain volume values are independent, it suggest that FA does not contain any information about brain volume, suggesting that using FA should not yield any different results
pvals = []

for genotype in genotypes:
    dcorr = hyppo.independence.Dcorr()
    stat, pval = dcorr.test(vol_dat[genotype].T, fa_dat[genotype].T)
    pvals.append([genotype, pval])

pval_df = pd.DataFrame(pvals, columns=["Genotype", "P-value"])

pval_df
| Genotype | P-value | |
|---|---|---|
| 0 | APOE22 | 0.000121 |
| 1 | APOE33 | 0.000197 |
| 2 | APOE44 | 0.000104 |
These p-values suggest that FA and brain volume are depedent.
Testing whether brain volume and FA correlations are independent#
Similar analysis, but we are evaluating the correlations
pvals = []

for genotype in genotypes:
    dcorr = hyppo.independence.Dcorr(compute_distance=None)
    stat, pval = dcorr.test(vol_cor[genotype].T, fa_cor[genotype].T)
    pvals.append([genotype, pval])

pval_df = pd.DataFrame(pvals, columns=["Genotype", "P-value"])

pval_df
| Genotype | P-value | |
|---|---|---|
| 0 | APOE22 | 0.000117 |
| 1 | APOE33 | 0.000002 |
| 2 | APOE44 | 0.000253 |
Again, the p-values suggest that brain volume and FA correlations are not independent
Using omnibus embedding and multiple adjacency spectral embedding to simulataneously embed brain volume and FA#
omni = OmnibusEmbed()

embeddings = [omni.fit_transform([vol_cor[genotype], fa_cor[genotype]])[0] for genotype in genotypes]

embeddings = np.hstack(embeddings)
embeddings.shape
(332, 13)
U, D, V = select_svd(embeddings)
D.shape
(2,)
Hierarchical clustering on the embeddings#
cluster = gp.cluster.DivisiveCluster(max_level=3)

cluster_labels = cluster.fit_predict(U, fcluster=True)

cluster_label_df = pd.DataFrame(cluster_labels, columns=["cluster_level_1", "cluster_level_2", "cluster_level_3"])
def count_groups(label_matrix):
    levels = label_matrix.shape[1] - 1
    d = []

    for level in range(levels):
        upper_cluster_ids = np.unique(label_matrix[:, level])

        for upper_cluster_id in upper_cluster_ids:
            lower_cluster_ids, counts = np.unique(
                label_matrix[label_matrix[:, level] == upper_cluster_id][:, level + 1], return_counts=True
            )

            for idx, lower_cluster_id in enumerate(lower_cluster_ids):
                if upper_cluster_id == lower_cluster_id:
                    lower_cluster_id = None
                d.append((upper_cluster_id, lower_cluster_id, counts[idx]))

    d = np.array(d)

    source = d[:, 0]
    target = d[:, 1]
    value = d[:, 2]

    return source, target, value

def append_apriori_labels(apriori_labels, cluster_matrix):
    encoder = LabelEncoder()
    apriori_labels_encoded = encoder.fit_transform(apriori_labels)
    apriori_labels_encoded = apriori_labels_encoded.reshape(-1, 1)

    # Increase the original cluster_matrix labels
    cluster_matrix_ = cluster_matrix + np.max(apriori_labels_encoded) + 1

    out = np.hstack([apriori_labels_encoded, cluster_matrix_])

    return out, list(encoder.classes_)

hemispheric_clusters, encoded_labels = append_apriori_labels(node_labels.Hemisphere, cluster_labels)

source, target, value = count_groups(hemispheric_clusters)
Visualizing Sankey#
fig = go.Figure(data=[go.Sankey(
    node = dict(
      pad = 15,
      thickness = 20,
      line = dict(color = "black", width = 0.5),
      label = encoded_labels + [f"Cluster {i}" for i in range(np.max(hemispheric_clusters))]
    ),
    link = dict(
      source = source,
      target = target,
      value = value
  ))])

fig.update_layout(title_text="Hemispheric Clustering", font_size=10)
fig.show(dpi=300, width=1000, height=600)

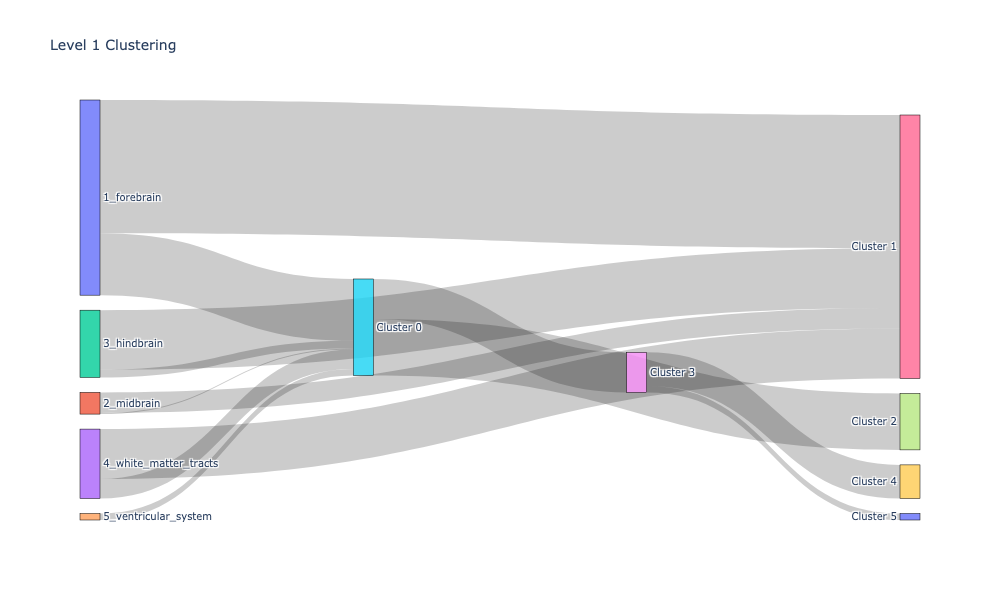
level_1_clusters, encoded_labels = append_apriori_labels(node_labels.Level_1, cluster_labels)

source, target, value = count_groups(level_1_clusters)
fig = go.Figure(data=[go.Sankey(
    node = dict(
      pad = 15,
      thickness = 20,
      line = dict(color = "black", width = 0.5),
      label = encoded_labels + [f"Cluster {i}" for i in range(np.max(level_1_clusters[0]))],
    ),
    link = dict(
      source = source,
      target = target,
      value = value
  ))])

fig.update_layout(title_text="Level 1 Clustering", font_size=10)
fig.show(dpi=300, width=1000, height=600)
cl = pd.DataFrame(cluster_labels, columns=[f"Cluster_{i}" for i in range(1, 4)])
meta = pd.concat([node_labels, cl], axis=1)
meta.head()
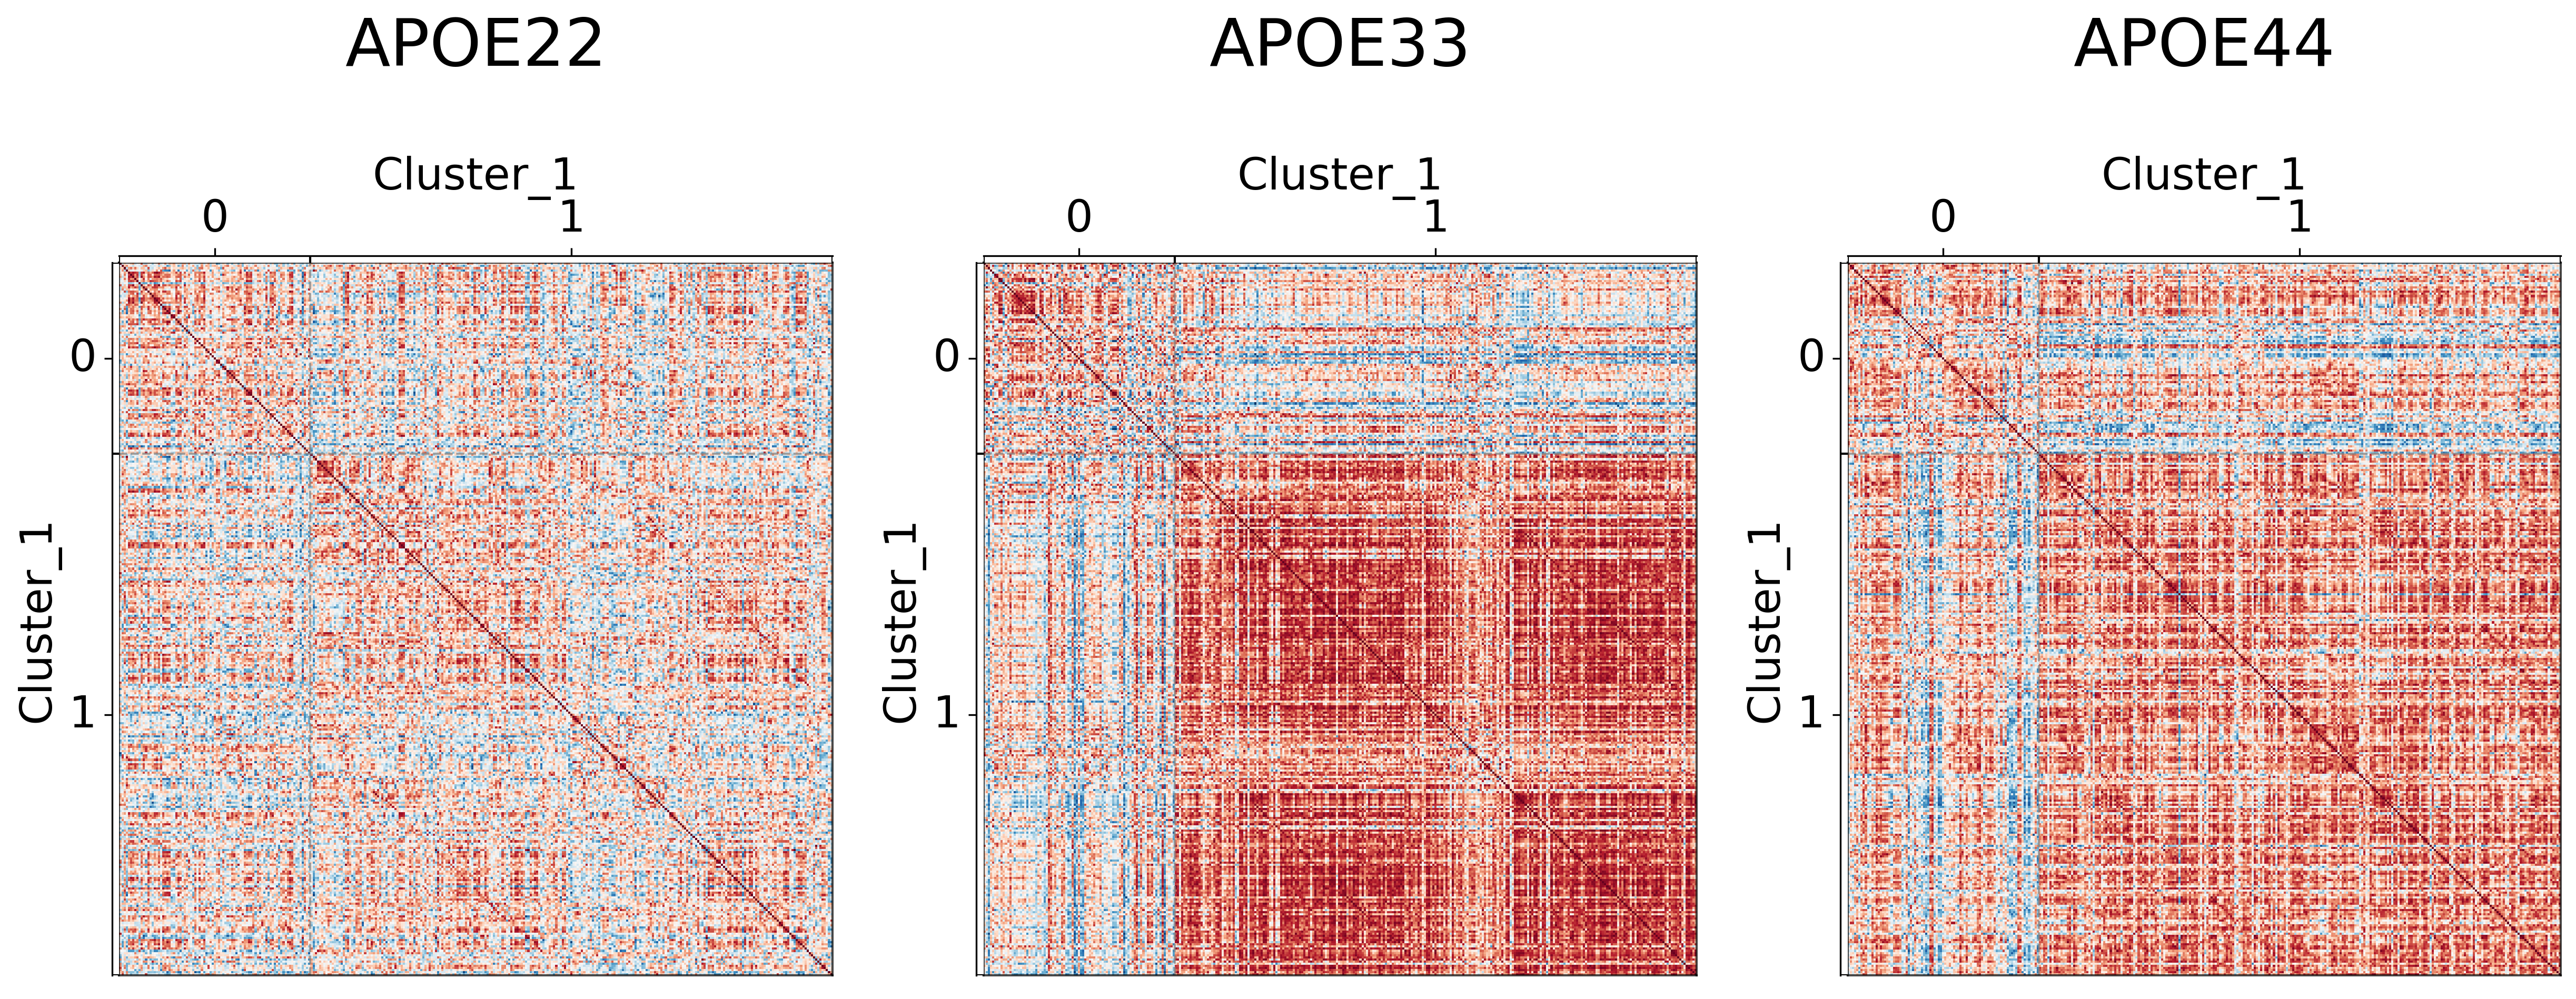
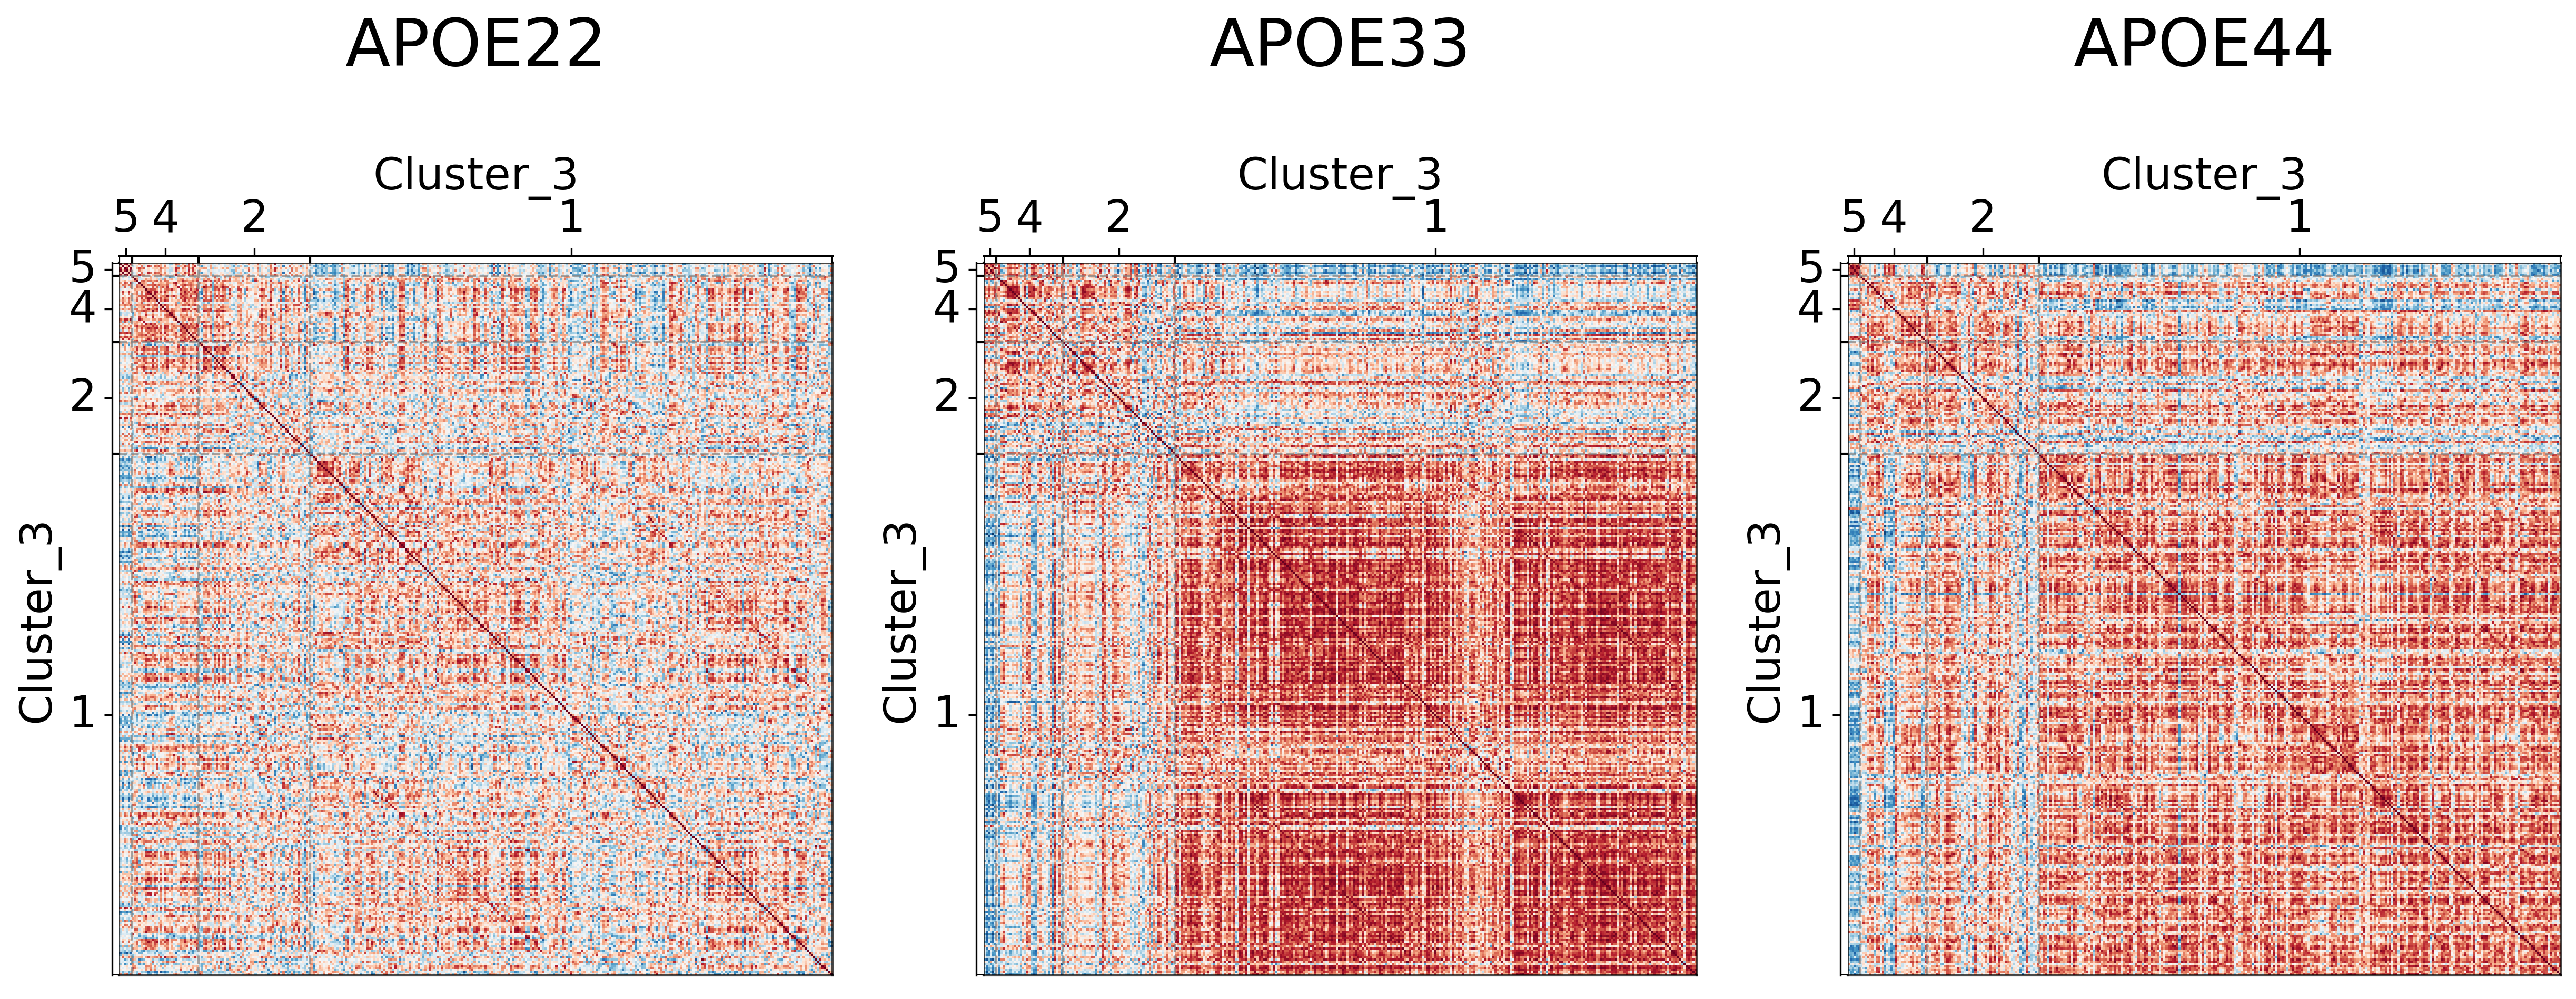
## Plot to make sure nothing is wrong
for l in range(3):
fig, ax = plt.subplots(
ncols=3,
figsize=(20, 10),
#constrained_layout=True,
dpi=300,
gridspec_kw=dict(width_ratios=[1, 1, 1])
)
for (i, genotype) in enumerate(vol_cor.keys()):
gp.plot.adjplot(
vol_cor[genotype],
ax=ax[i],
vmin=-1,
vmax=1,
meta=meta,
group=[f'Cluster_{l+1}'],
)
ax[i].set_title(f"{genotype}", pad=90, size=30)
fig.savefig(f"./figures/2022-02-02-multigraph-clustering-level-{l + 1}.png", bbox_inches='tight')

Comparing results to prior clusterings#
mase = gp.embed.MultipleASE()
Vhat = mase.fit_transform([corr for _, corr in vol_cor.items()])
cluster = gp.cluster.DivisiveCluster(max_level=3)

cluster_labels = cluster.fit_predict(Vhat, fcluster=True)

cluster_label_df_ = pd.DataFrame(cluster_labels, columns=["cluster_level_1", "cluster_level_2", "cluster_level_3"])
from sklearn.metrics import adjusted_rand_score
adjusted_rand_score(cluster_label_df_.cluster_level_3, cluster_label_df.cluster_level_3)
0.6562743402239853