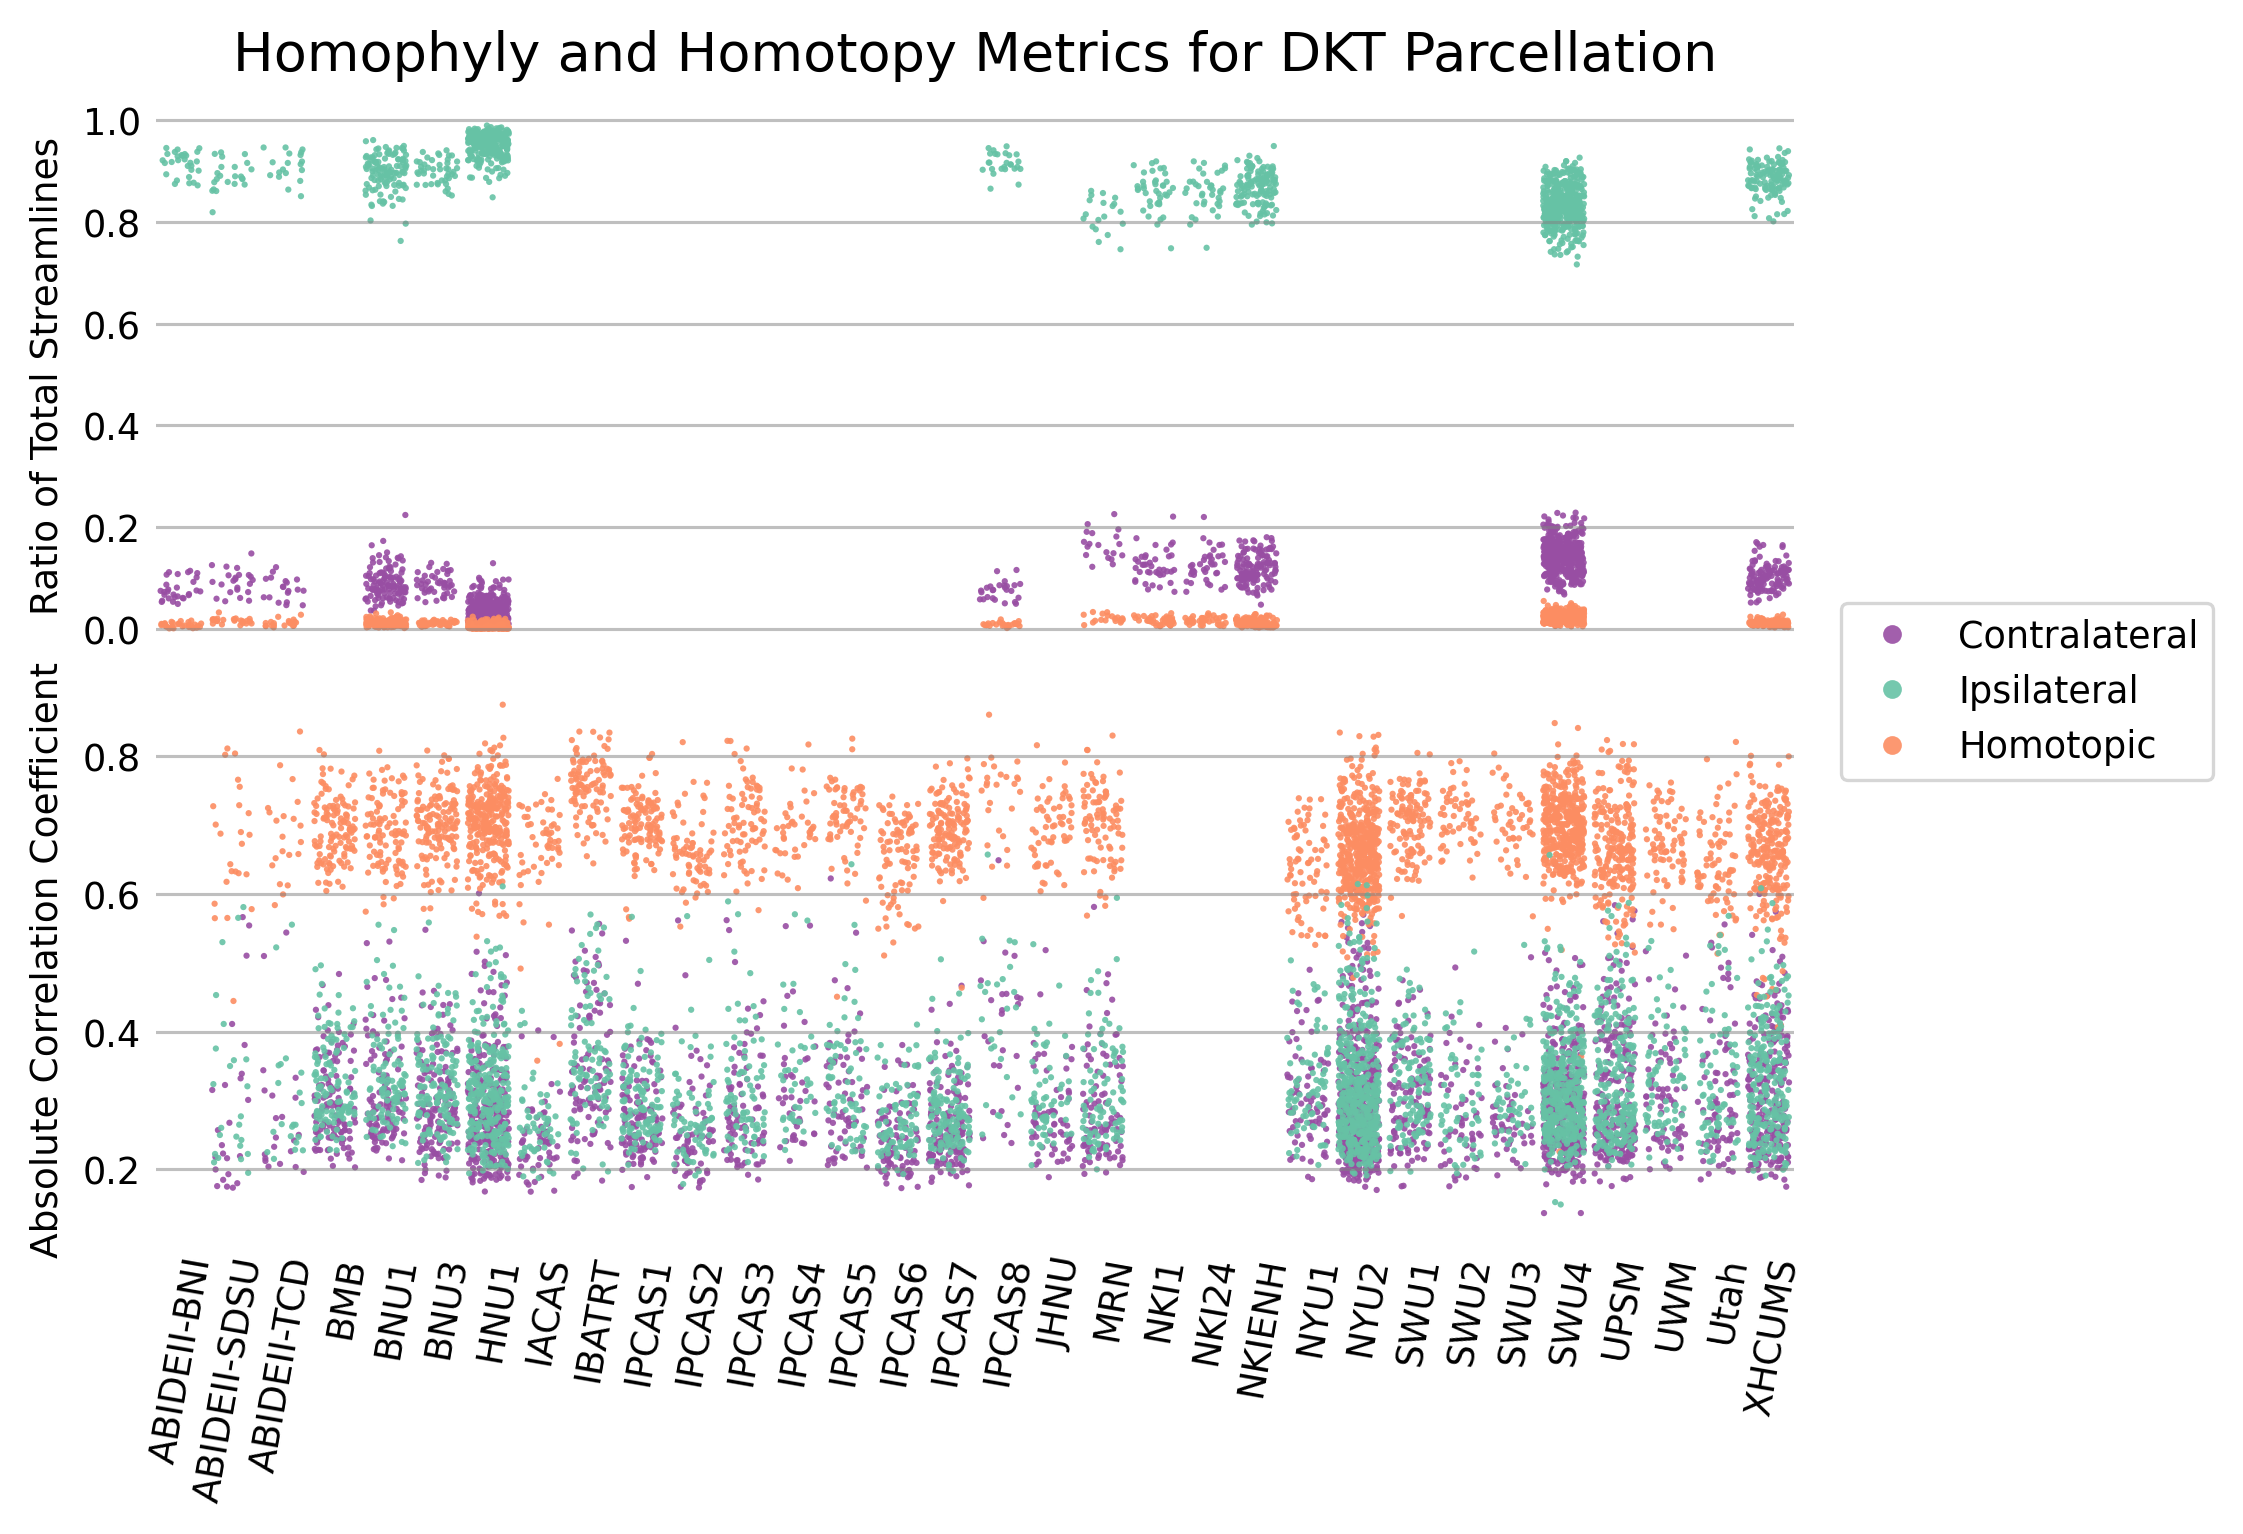
Figure 4 - Connectome biological plausibility results
Analysis of the edge weights of both structural (top) and functional (bottom) connectomes estimated using the DKT parcellation method. For the structural connectomes, the mean of the percentage of streamlines observed between ipsilateral, contralateral, and homotopic ROIs was recorded and plotted for each scan. Mean Pearson correlation coefficients between ipsilateral, contralateral, and homotopic ROIs was plotted for functional connectomes. A consistent significantly higher ratio of ipsilateral connections was observed across parcellation methods for structural connectomes, as well as a higher correlation between homotopic ROIs across parcellation methods in functional connectomes.
[1]:
import pandas as pd
import seaborn as sns
import matplotlib.pyplot as plt
import matplotlib as mpl
import numpy as np
[2]:
datasets = [
    "ABIDEII-BNI_1",
    "ABIDEII-SDSU_1",
    "ABIDEII-TCD_1",
    "BMB_1",
    "BNU1",
    "BNU3",
    "HNU1",
    "IACAS_1",
    "IBATRT",
    "IPCAS1",
    "IPCAS3",
    "IPCAS4",
    "IPCAS7",
    "IPCAS_2",
    "IPCAS_5",
    "IPCAS_6",
    "IPCAS_8",
    "JHNU_bids",
    "MRN_1",
    "NKI1",
    "NKI24_new",
    "NKIENH",
    "NYU_1",
    "NYU_2",
    "SWU1",
    "SWU2",
    "SWU3",
    "SWU4",
    "UPSM_1",
    "UWM",
    "Utah1",
    "XHCUMS",
]

replace = {
    "ABIDEII-BNI_1": "ABIDEII-BNI",
    "ABIDEII-SDSU_1": "ABIDEII-SDSU",
    "ABIDEII-TCD_1": "ABIDEII-TCD",
    "BMB_1": "BMB",
    "BNU1": "BNU1",
    "BNU3": "BNU3",
    "HNU1": "HNU1",
    "IACAS_1": "IACAS",
    "IPCAS_2": "IPCAS2",
    "IPCAS_5": "IPCAS5",
    "IPCAS_6": "IPCAS6",
    "IPCAS_8": "IPCAS8",
    "JHNU_bids": "JHNU",
    "MRN_1": "MRN",
    "NKI24_new": "NKI24",
    "NYU_1": "NYU1",
    "NYU_2": "NYU2",
    "UPSM_1": "UPSM",
    "Utah1": "Utah",
}
[5]:
# Set up the plot
sns.set_context("paper", font_scale=1)
np.random.seed(1)

fig, ax = plt.subplots(
    nrows=2, dpi=300, figsize=(6, 5), sharex=True, constrained_layout=True
)
sns.despine(bottom=True, left=True)

for i in np.linspace(0, 1, 6):
    ax[0].axhline(y=i, color="gray", linestyle="-", lw=0.75, alpha=0.5)

for i in np.linspace(0.2, 0.8, 4):
    ax[1].axhline(y=i, color="gray", linestyle="-", lw=0.75, alpha=0.5)


plot_dict = dict(
    palette=["#984ea3", "#66c2a5", "#fc8d62"],
    zorder=1,
    x="Dataset",
    y="Value",
    hue="Type",
    alpha=0.9,
    legend=True,
    size=1.5,
    jitter=0.4,
    hue_order=["Contra", "Ipsi", "Hom"],
)

# Top panel
parc = "dkt"
df = pd.read_csv(f"./data/dwi_ipsi_{parc}.csv", delimiter=" ")
df = df[df.Dataset != "Dataset"]
df.Value = df.Value.astype(float)
uniques = np.unique(df.Dataset)

for i in datasets:
    if i not in uniques:
        df.loc[df.index[-1] + 1] = {
            "Dataset": i,
            "Atlas": "DKT",
            "Type": "Ipsi",
            "Value": np.nan,
        }

df.Dataset.replace(replace, inplace=True)
df.sort_values(by=["Dataset", "Type"], inplace=True)
sns.stripplot(data=df, ax=ax[0], **plot_dict)
ax[0].get_legend().remove()

# Bottome panel
parc = "dkt"
df = pd.read_csv(f"./data/func_ipsi_{parc}.csv", delimiter=" ")
df = df[df.Dataset != "Dataset"]
df.Value = df.Value.astype(float)
uniques = np.unique(df.Dataset)

for i in datasets:
    if i not in uniques:
        df.loc[df.index[-1] + 1] = {
            "Dataset": i,
            "Atlas": "DKT",
            "Type": "Ipsi",
            "Value": np.nan,
        }

df.Dataset.replace(replace, inplace=True)
df.sort_values(by=["Dataset", "Type"], inplace=True)
sns.stripplot(data=df, ax=ax[1], **plot_dict)
ax[1].get_legend().remove()

plt.setp(ax[1].get_xticklabels(), rotation=80, ha="right", rotation_mode="anchor")

dx = 15 / 300.0
dy = 0 / 300.0
offset = mpl.transforms.ScaledTranslation(-dx, dy, fig.dpi_scale_trans)
# apply offset transform to all x ticklabels.
for axes in [ax[0], ax[1]]:
    for label in axes.xaxis.get_majorticklabels():
        label.set_transform(label.get_transform() + offset)


# Deal with legends
handles, labels = ax[1].get_legend_handles_labels()

legend = fig.legend(
    handles[:],
    ["Contralateral", "Ipsilateral", "Homotopic"],
    ncol=1,
    loc="center right",
    bbox_to_anchor=(1.23, .55),
    bbox_transform=plt.gcf().transFigure,
    markerscale=3,
)


for axes in ax:
    length = 0
    axes.xaxis.set_tick_params(length=length, width=1)
    axes.yaxis.set_tick_params(length=length, width=1)


ax[0].set_ylabel("Ratio of Total Streamlines", fontsize=9)
ax[1].set_ylabel("Absolute Correlation Coefficient", fontsize=9)
ax[0].set_title("Homophyly and Homotopy Metrics for DKT Parcellation", fontsize=13)
ax[1].set_xlabel("")

fig.savefig("./figures/figure4.pdf", bbox_inches="tight", dpi=300)
fig.savefig("./figures/figure4.png", bbox_inches="tight", dpi=300)
