Note
Go to the end to download the full example code.
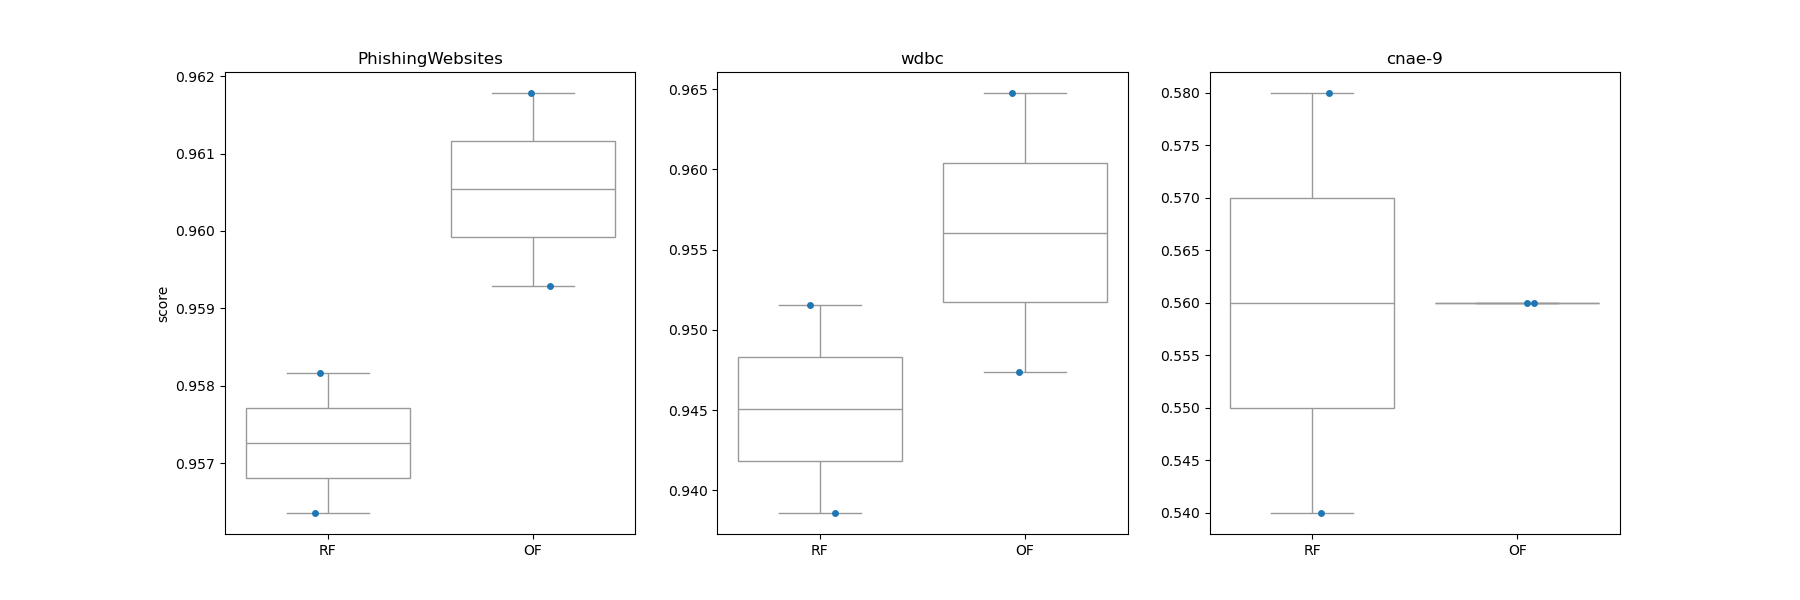
Plot oblique forest and axis-aligned random forest predictions on cc18 datasets#
A performance comparison between oblique forest and standard axis- aligned random forest using three datasets from OpenML benchmarking suites.
Two of these datasets, namely [WDBC](https://www.openml.org/search?type=data&sort=runs&id=1510) and [Phishing Website](https://www.openml.org/search?type=data&sort=runs&id=4534) datasets consist of 31 features where the former dataset is entirely numeric and the latter dataset is entirely norminal. The third dataset, dubbed [cnae-9](https://www.openml.org/search?type=data&status=active&id=1468), is a numeric dataset that has notably large feature space of 857 features. As you will notice, of these three datasets, the oblique forest outperforms axis-aligned random forest on cnae-9 utilizing sparse random projection mechanism. All datasets are subsampled due to computational constraints.
For an example of using extra-oblique trees/forests in practice on data, see the following example Compare extra oblique forest and oblique random forest predictions on cc18 datasets.
Loading [PhishingWebsites] dataset..
Loading [wdbc] dataset..
Loading [cnae-9] dataset..
It took 5 seconds to run the script
from datetime import datetime

import matplotlib.pyplot as plt
import pandas as pd
import seaborn as sns
from sklearn.datasets import fetch_openml
from sklearn.ensemble import RandomForestClassifier
from sklearn.model_selection import RepeatedKFold, cross_validate

from treeple import ObliqueRandomForestClassifier

random_state = 123456
t0 = datetime.now()
data_ids = [4534, 1510, 1468]  # openml dataset id
df = pd.DataFrame()


def load_cc18(data_id):
    df = fetch_openml(data_id=data_id, as_frame=True, parser="pandas")

    # extract the dataset name
    d_name = df.details["name"]

    # Subsampling large datasets
    if data_id == 1468:
        n = 100
    else:
        n = int(df.frame.shape[0] * 0.8)

    df = df.frame.sample(n, random_state=random_state)
    X, y = df.iloc[:, :-1], df.iloc[:, -1]

    return X, y, d_name


def get_scores(X, y, d_name, n_cv=5, n_repeats=1, **kwargs):
    clfs = [RandomForestClassifier(**kwargs), ObliqueRandomForestClassifier(**kwargs)]

    tmp = []

    for i, clf in enumerate(clfs):
        cv = RepeatedKFold(n_splits=n_cv, n_repeats=n_repeats, random_state=kwargs["random_state"])
        test_score = cross_validate(estimator=clf, X=X, y=y, cv=cv, scoring="accuracy")

        tmp.append(
            [
                d_name,
                ["RF", "OF"][i],
                test_score["test_score"],
                test_score["test_score"].mean(),
            ]
        )

    df = pd.DataFrame(
        tmp, columns=["dataset", "model", "score", "mean"]
    )  # dtype=[('model',object), ('score',float), ('mean',float)])
    df = df.explode("score")
    df["score"] = df["score"].astype(float)
    df.reset_index(inplace=True, drop=True)

    return df


params = {
    "max_features": None,
    "n_estimators": 50,
    "max_depth": None,
    "random_state": random_state,
    "n_cv": 2,
    "n_repeats": 1,
}

for data_id in data_ids:
    X, y, d_name = load_cc18(data_id=data_id)
    print(f"Loading [{d_name}] dataset..")
    tmp = get_scores(X=X, y=y, d_name=d_name, **params)
    df = pd.concat([df, tmp])

print(f"It took {(datetime.now()-t0).seconds} seconds to run the script")

# Draw a comparison plot
d_names = df.dataset.unique()
N = d_names.shape[0]

fig, ax = plt.subplots(1, N)
fig.set_size_inches(6 * N, 6)

for i, name in enumerate(d_names):
    sns.stripplot(
        data=df.query(f'dataset == "{name}"'),
        x="model",
        y="score",
        ax=ax[i],
        dodge=True,
    )
    sns.boxplot(
        data=df.query(f'dataset == "{name}"'),
        x="model",
        y="score",
        ax=ax[i],
        color="white",
    )
    ax[i].set_title(name)
    if i != 0:
        ax[i].set_ylabel("")
    ax[i].set_xlabel("")
Total running time of the script: (0 minutes 5.143 seconds)