Hildebrand16
Hildebrand16 Guide
Introduction
The goal of this guide is to familiarize users with the Hildebrand16 electron microscopy (EM) image database and the tools used to serve it. The database consists of a collection of serial-section EM (ssEM) image volumes acquired at different resolutions that collectively encompass the anterior quarter of one 5.5 days post-fertilization larval zebrafish.
We generated the datasets that form this database to study the anatomy of the larval zebrafish brain–which is included in its entirety–and peripheral nervous system. Toward this goal, we reconstructed and annotated some features of the nervous system, namely myelinated neuronal processes, which are also available for browsing or analysis. Many non-neuronal tissues are captured in the database.
Software
All electron micrographs and reconstructions are hosted using the Collaborative Annotation Toolkit for Massive Amounts of Image Data (CATMAID). CATMAID is designed to aid in the annotation and sharing of image datasets. This guide serves as an initial reference to help users navigate the CATMAID instance we use to host the database. For a more thorough understanding of the software and its functionality, please visit the CATMAID documentation page. Note that using the Google Chrome browser for interacting with CATMAID is highly recommended.
Getting started
Accessing
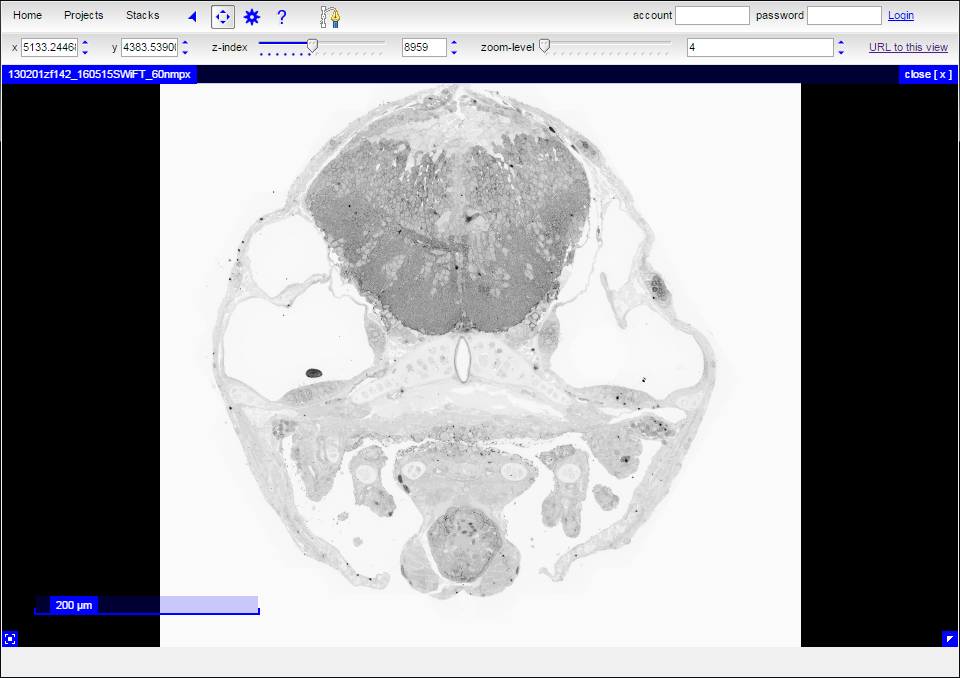
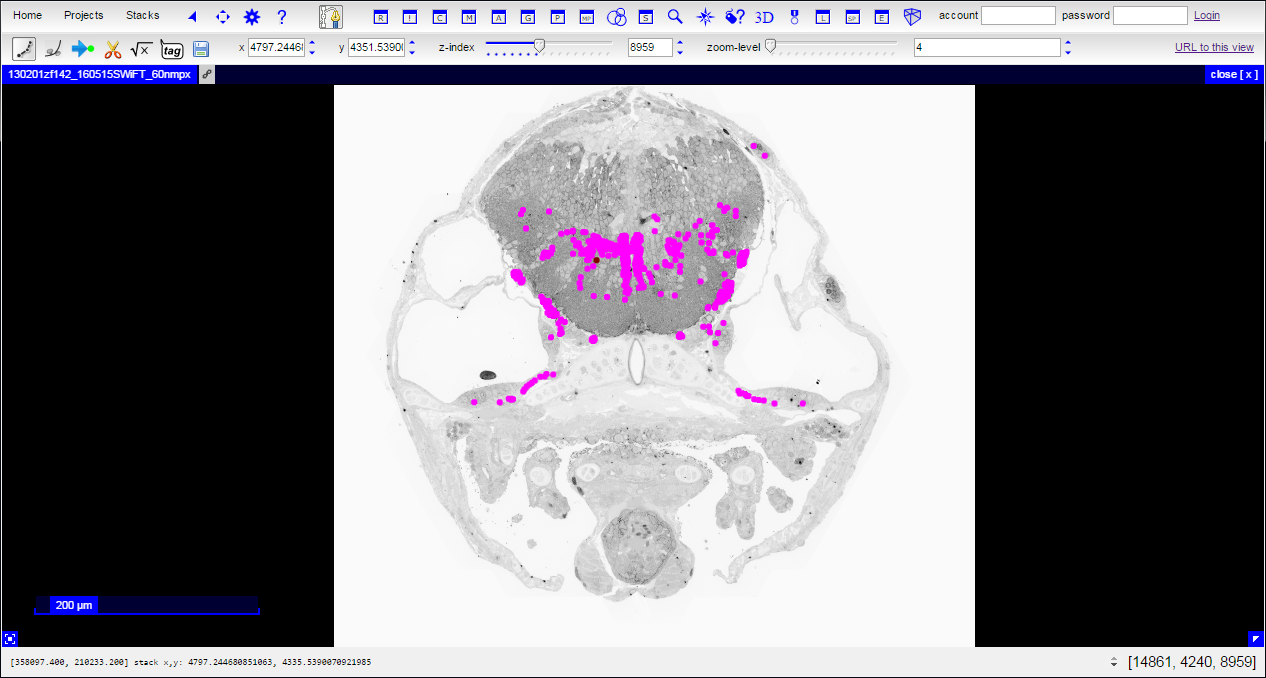
Clicking on either the “View data” the “View data with reconstructions” link on the main page will immediately transport you into CATMAID. The colored dots visible in the “View data with reconstructions” option are positions where a reconstructed object such as a myelinated neuron intersects with the current transverse section.
| View data | View data and reconstructions |
|---|---|
 |
 |
Navigating
Across the top of the page in CATMAID, you will see a toolbar. The toolbar provides useful information about the current view and contains various tools with which to interact with the data.
Orienting
Displayed in the toolbar are the current position, section number, and zoom level. The current position is defined by the center of the field of view (x, y; in nm from the top left corner) and the section number (z-index; each ~60 nm):

The zoom level for the field of view can be set to visualize the full extents of the transverse section at low resolution or a restricted field of view at high resolution:

The approximate resolution associated with each zoom level is:
| Zoom level | Resolution |
|---|---|
| 5 | 1.8 μm/px |
| 4 | 0.9 μm/px |
| 3 | 451.2 nm/px |
| 2 | 225.6 nm/px |
| 1 | 112.8 nm/px |
| 0 | 56.4 nm/px |
| -1 | 28.2 nm/px |
| -2 | 14.1 nm/px † |
| -3 | 7.05 nm/px † |
†Artificially upsampled. The actual resolution of raw data is 18.8 nm/px within most brain regions and 56.4 nm/px outside the brain.
Panning
To pan around the current transverse section, click the pan tool button on the toolbar:

Holding down your left mouse button while dragging will pan your view. Alternatively, if you have a middle mouse button, hold it down when any tool is selected and drag to pan your view.
Viewing reconstructions
To view existing neuron reconstructions, click the tracing tool button on the toolbar:

Colored dots will appear on top of the EM data:

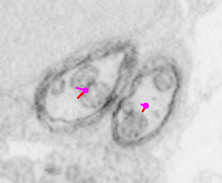
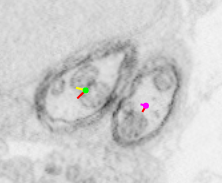
Each dot is a single node indicating where the current section intersects with a directed polyline (or treeline) annotation used to represent the morphology of a particular neuron. A polyline representation of a neuron is commonly referred to as a skeleton. Clicking the spacebar key toggles between viewing reconstructions as overlays on the data and a data-only view. Any given node (and, thus, neuron) can be selected by hovering over it with the mouse cursor and pressing the ‘g’ key.
| No node selected | Node selected (green) |
|---|---|
 |
 |
Viewing tags (meta-information)
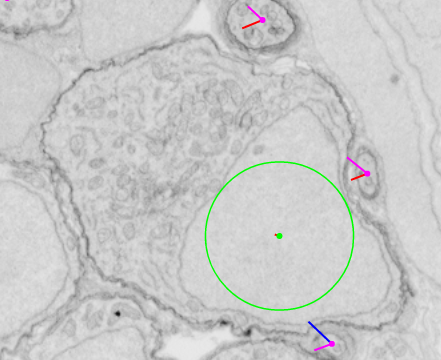
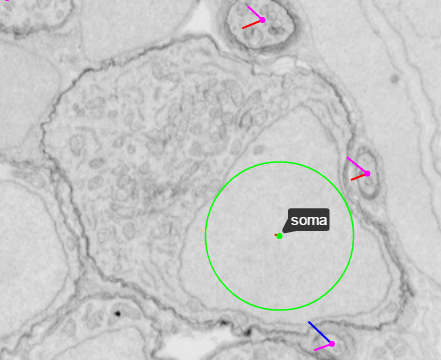
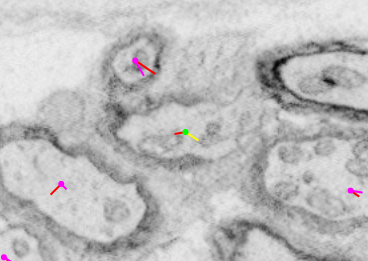
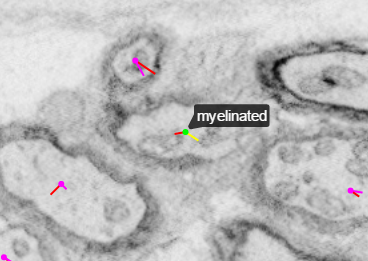
Tags are meta-information associated with individual nodes. To view the tags associated with individual nodes, click the tag tool button on the toolbar or press the ‘7’ key:

Tags are useful for indicating specific features such as the location of a soma (which we mark as the center of the nucleus) or the position where a neuronal process becomes myelinated.
| Without tag view | With tag view |
|---|---|
 |
 |
 |
 |
Finding reconstructed neurons
Included in the database are several reconstructions, including all myelinated neurons that we could find. Some of these neurons are named or annotated and can be found with the CATMAID search functions. To search by name or annotation, click the neuron/annotation search button on the toolbar or press the ’/’ key:

This action will add a new panel to your CATMAID session. In the new panel, there are fields for name or annotation searching. You can, for example, search for the Mauthner neurons by name or annotation by typing in ‘Mauthner’:
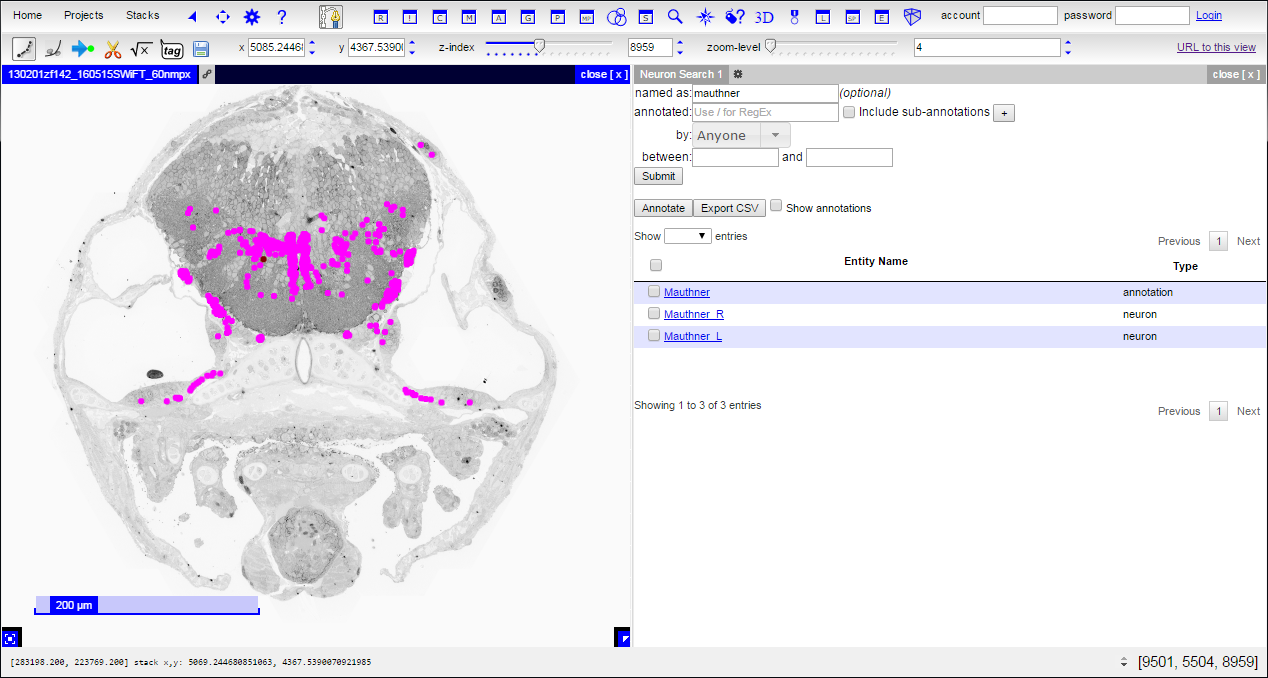
If the search result type is ‘annotation’, clicking on it will list neurons with that annotation. If the search result type is ‘neuron’, clicking on it will select the neuron as active and color its nodes in the main panel. Additionally, checkboxes in the table can select results for performing other functions, such as adding annotations or adding the reconstructions to a three-dimensional (3D) view.
Searchable annotations currently include:
| Annotation | Description |
|---|---|
| anterior_crista | Innervates the inner ear anterior crista |
| anterior_macula | Innervates the inner ear anterior macula (utricle) |
| blacklist | Marks for exclusion from any analysis, rendering, or statistics |
| bundle | Rough reconstruction of a nerve bundle/tract |
| ear | Related to the ear |
| damaged | Reconstruction incomplete or inaccurate due to tissue damage |
| lateral_line | Member of the lateral line system |
| left | Soma (or majority if no soma) is on the left side |
| marker | Marks a specific (typically non-neuronal) structure |
| medial_crista | Innervates the inner ear medial crista |
| motor | Directly innervates a muscle |
| myelinated | Some portion of neuron or fragment is myelinated |
| heart | Related to the heart |
| not_neuronal | Not a neuron |
| neuromast | Marks a neuromast |
| neuromast_afferent | Innervates a neuromast |
| nucMLF | Member of the nucleus of the medial longitudinal fasciculus |
| oculomotor | Member of the oculomotor nucleus |
| optic_nerve | Member of the optic nerve |
| peripheral | Member of the peripheral nervous system |
| PLLn | Travels through the posterior lateral line nerve (PLLn) |
| posterior_crista | Innervates the inner ear posterior crista |
| posterior_macula | Innervates the inner ear posterior macula (saccule) |
| putative | Class or identity designation is putative |
| render | Marks for inclusion in reconstruction renderings |
| render_blacklist | Marks for exclusion from reconstruction renderings |
| reticulospinal | Member of the reticulospinal system |
| right | Soma (or majority if no soma) is on the right side |
| saccule | Marks a saccule |
| sensory | Directly innervates a sensory organ |
| spinal_backfill | Typically labeled by spinal backfill experiments |
| spinal_projection | Sends axon to the spinal cord |
| stats | Marks for inclusion in reconstruction statistics |
| stats_blacklist | Marks for exclusion from reconstruction statistics |
| symmetry | Marks for inclusion in symmetry analysis |
| symmetry_blacklist | Marks for exclusion from symmetry analysis |
| tract | Rough reconstruction of a nerve bundle/tract |
| unmyelinated | No known portion is myelinated |
| unknown | Class or identity of neuron is unknown or not yet labeled |
| utricle | Marks a utricle |
| ventral_root | Member of a vental root nerve |
| vestibulospinal | Member of the vestibulospinal system |
| volume | Marks a reconstruction used to create a volume |
Annotations also exist for identified neurons or classes:
| Annotation | Description |
|---|---|
| CaD | CaD neuron |
| CaP | (Ca)udal (P)rimary motor neuron class |
| CaV | CaV neuron class |
| Mauthner | Mauthner neuron |
| MeL | MeL neuron class of nucMLF |
| MeLc | MeLc neuron |
| MeLm | MeLm neuron |
| MeLr | MeLr neuron |
| MeM | MeM neuron class of nucMLF |
| MeMd | dorsal MeM neuron |
| MeMv | ventral MeM neuron |
| MiD | MiD2 or MiD3 neuron class |
| MiD2 | MiD2cm, MiD2cl, or MiD2i neuron |
| MiD2cm | MiD2cm neuron |
| MiD2cl | MiD2cl neuron |
| MiD2i | MiD2i neuron |
| MiD3 | MiD3cm, MiD3cl, or MiD3i neuron |
| MiD3cm | MiD3cm neuron |
| MiD3cl | MiD3cl neuron |
| MiD3i | MiD3i neuron |
| MiM1 | MiM1 neuron class |
| MiR | MiR1 or MiR2 neuron |
| MiR1 | MiR1 neuron |
| MiR2 | MiR2 neuron |
| MiT | MiT neuron class |
| MiV | MiV1 or MiV2 neuron class |
| MiV1 | MiV1 neuron class |
| RoI2 | RoI2C neuron class or RoI2R neuron |
| RoI2C | RoI2C neuron class |
| RoI2R | RoI2R neuron |
| RoL | RoL1, RoL2, or RoL3 neuron class |
| RoL1 | RoL1 neuron class |
| RoL2 | RoL2 neuron class |
| RoL3 | RoL3 neuron |
| RoM | RoM1, RoM2, or RoM3 neuron class |
| RoM1 | RoM1C or RoM1R neuron |
| RoM1C | RoM1C neuron |
| RoM1R | RoM1R neuron |
| RoM2 | RoM2L or RoM2M neuron |
| RoM2L | RoM2L neuron |
| RoM2M | RoM2M neuron |
| RoM3 | RoM3L neuron or RoM3M neuron class |
| RoM3L | RoM3L neuron |
| RoM3M | RoM3M neuron class |
| RoV3 | RoV3 neuron class |
Viewing reconstructions in 3D
Visualizing the morphology of a reconstructed neuron benefits from 3D renderings. CATMAID includes a 3D viewer for this purpose. To begin the process of rendering in 3D, click on the 3D view button:

This will add two new panes, including the 3D viewer and a selection table:
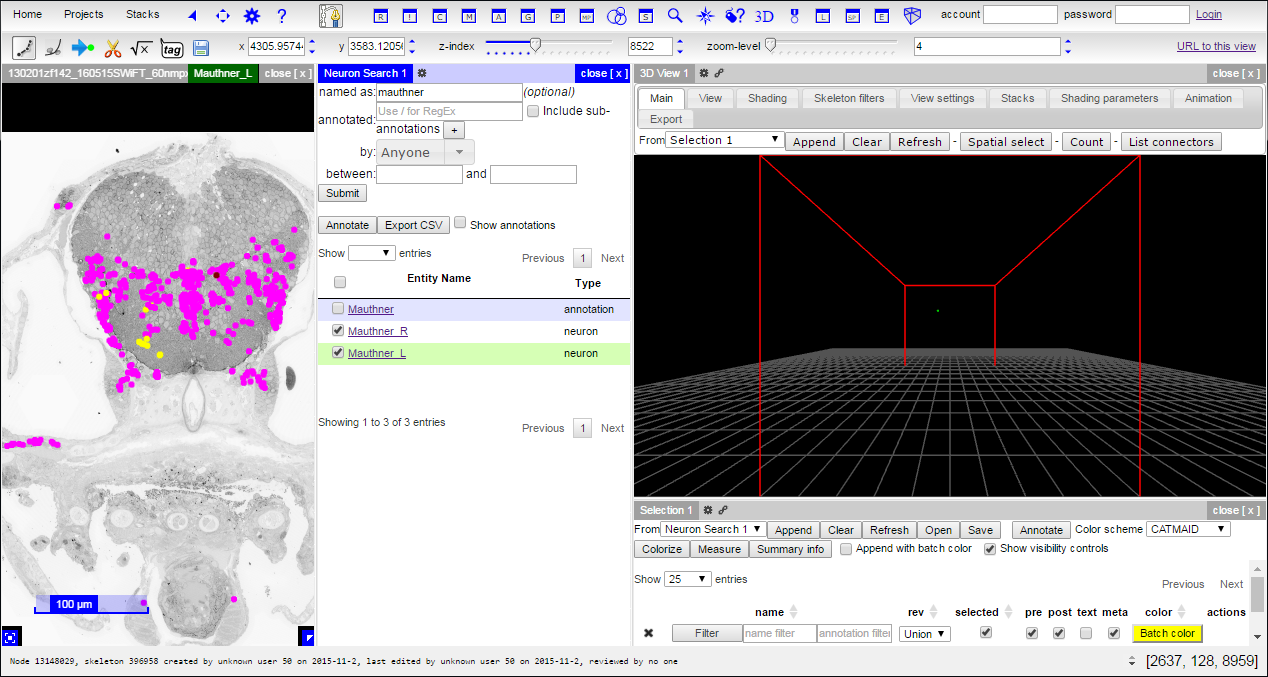
The currently active skeleton or results from searching for a particular neuron or class of neurons (i.e., by annotation) can be added to the 3D viewer by using the drop-down menu and append button in the selection pane. In the search results case, neurons can be added to the 3D view by checking the boxes next to result(s) of interest, selecting ‘Neuron Search 1’ in the drop-down menu, and clicking the Append button:

For both the left and right Mauthner neurons searched for previously, you will see a rendering of two neurons within a bounding box (red outline) defined by the image stack and a floor (white mesh):
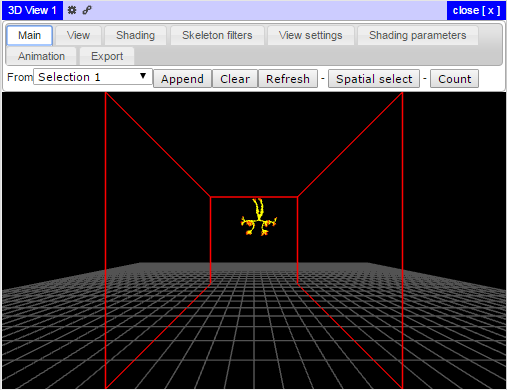
To rotate the view, click and drag the left mouse button. To zoom in or out, scroll your mouse wheel. To pan within the 3D viewer, click and drag the right mouse button. Several additional view and color settings are available in the 3D view and selection panes.
For example, it can be helpful to change the color associated with different neurons in the 3D viewer. The Colorize button in the Selection Table randomly assign colors to all neurons selected in the selection table:

It is also possible to perform a variety of other functions. For example, one can remove or add the display locations of nodes with meta-information such as tags or tracer confidence values by clicking the ‘meta’ checkbox in the Selection Table. One can also search for a particular neuron or class of neurons by name or annotation. Clicking on the Batch Color button will then label the selected subset in the Selection Table. Alternatively, the desired color can be specified for a single neuron by clicking on its color button in the appropriate Selection Table row:
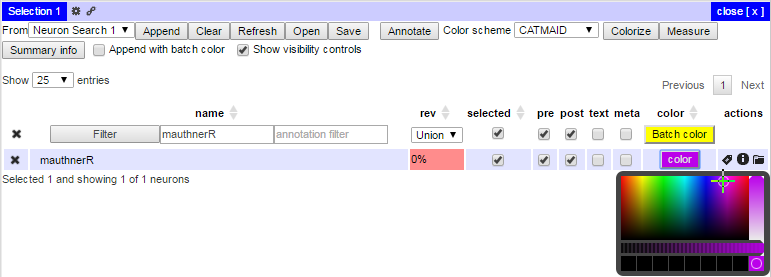
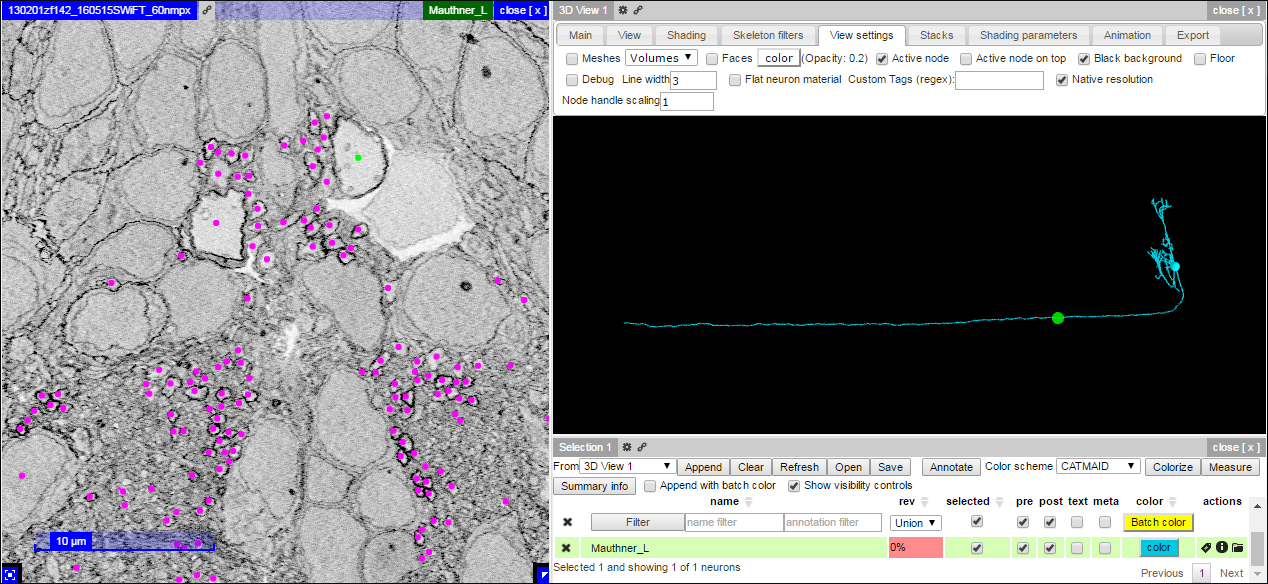
Identifying the location of the active node can be accomplished by checking the Active node setting in the 3D viewer View Settings panel:

With this setting, the 3D viewer will update a green sphere to the location of the active node as one interacts with the database:
Different resolutions
The database includes overlapping image stacks acquired at different resolutions. For a given section (z-index), images acquired at different resolutions are treated as layers. The higher resolution images are placed on top of–and obscuring the view of–the lower resolution images.
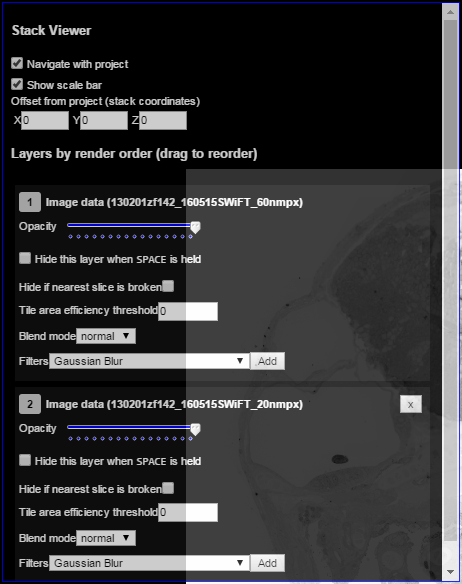
Click the layer controls button in the bottom left corner of the main pane to access options associated with each image stack layer:

Layer controls allow you to remove a particular image stack or resolution from view, change layer opacity, alter display settings, select a blend more, or add filters:
Overlay reference atlases
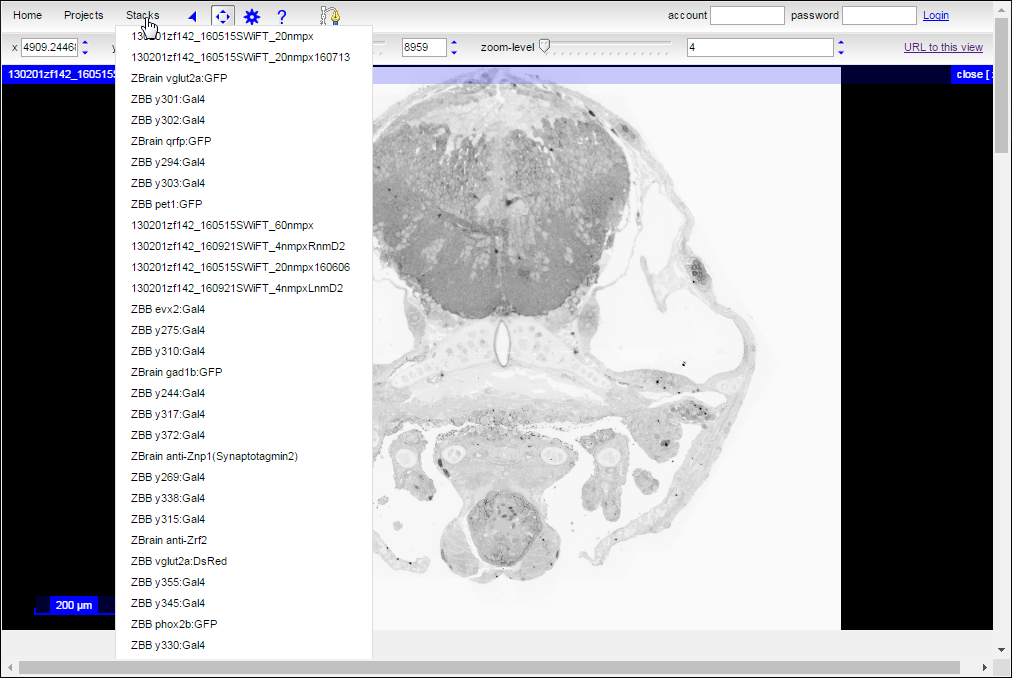
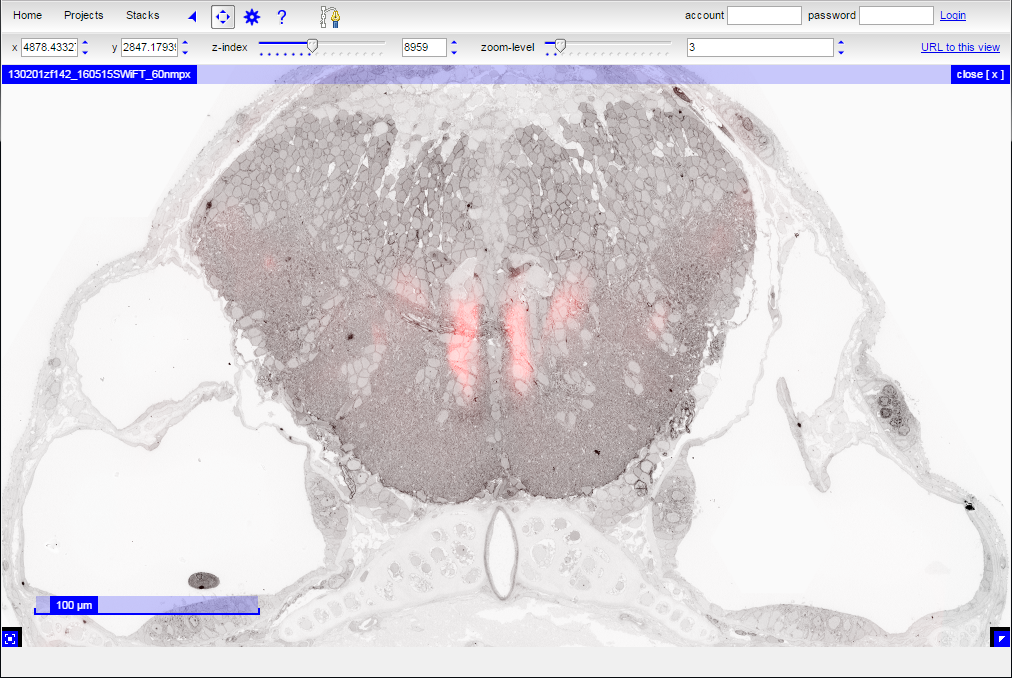
Two functional reference atlases–the Z-Brain atlas and the Zebrafish Brain Browser–were transformed into the database. Each stack from these atlases consists of a light microscopy image volume acquired from fluorescence associated with different gene expression profiles or labeling procedure. To overlay an atlas label onto the EM data, first highlight a selected stack using the Stacks menu:
Then add the highlighted stack to the focused viewer:

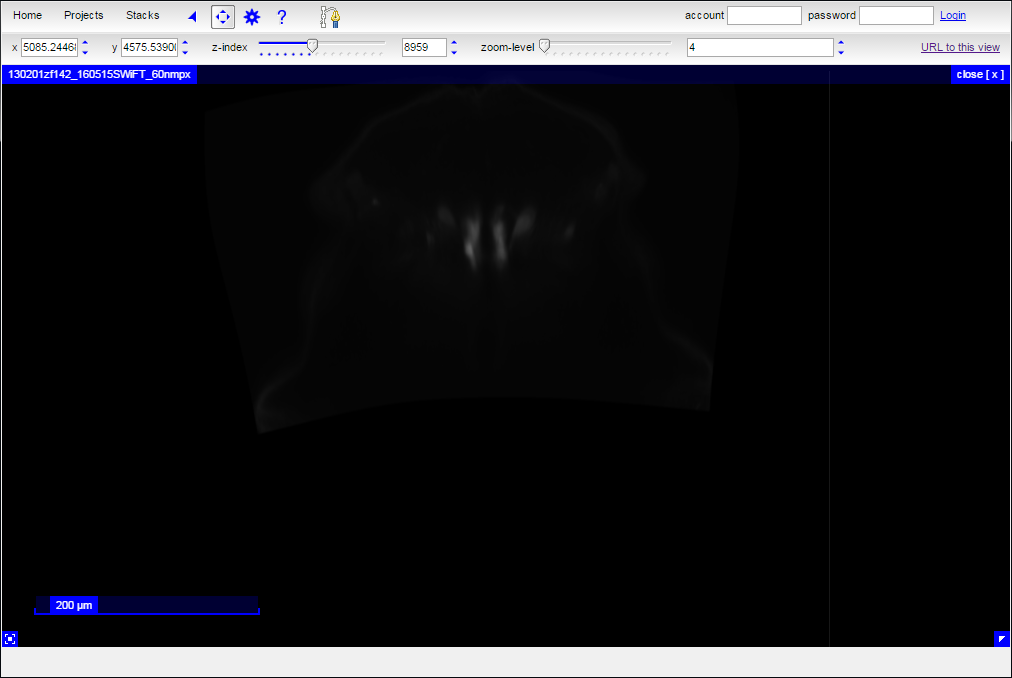
Initially, the added stack with obscure the view of the EM data:
Next, click the layer controls button in the bottom left corner of the main pane:

Scroll down to the stack that was just added (usually the bottom of the layer controls) and change its blend mode to ‘screen’:

Then, select the ‘color transform’ option from the available filters:
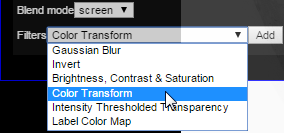
Add the new filter:

Change the settings associated with the color transform as desired. In this case, the transform is set to produce a red overlay:
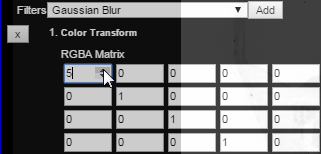
Finally, close the layer controls and view the resulting atlas overlay:
Application programming interface (API) access
In addition to interacting with the data through the CATMAID user interface, it is also possible to use the CATMAID API to interact with the database programmatically. Access to the API is available as AnonymousUser with an API token such that the request header includes { ‘X-Authorization’ : ‘Token 05e73cb0b0987fbf97070520b4570cb1624697f8’ }.
For example, this python script outputs a list of all skeletons, corresponding neuron names, and associated annotations:
import requests
from requests.auth import AuthBase as auth_base

class catmaid_API_token_auth(auth_base):
    """Attaches HTTP X-Authorization Token headers to the given Request."""
    def __init__(self, token):
        self.token = token

    def __call__(self, r):
        r.headers['X-Authorization'] = 'Token {}'.format(self.token)
        return r

# Settings
uri = 'http://hildebrand16.neurodata.io/catmaid'
token = '05e73cb0b0987fbf97070520b4570cb1624697f8'
project_name = '130201zf142_160515SWiFT_160701remap'

# Look up project_id from project_name
project_response = requests.get(
        uri + '/projects/',
        auth = catmaid_API_token_auth(token))
project_query_data = project_response.json()
project_id = [ project_query_data[i]['id'] for i in range(len(project_query_data))
    if project_query_data[i]['title'] == project_name ]
if project_id != []:
    project_id = project_id[0]
else:
    print 'Error: Project ' + project_name + ' does not exist.'

# Identify skeletons in this project
skeleton_response = requests.get(
        uri + '/{}/skeletons/'.format(project_id),
        auth = catmaid_API_token_auth(token))
skeleton_ids = skeleton_response.json()

# Collect lists of annotations corresponding to all skeletons
annotation_response = requests.post(
    uri + '/{}/annotations/forskeletons'.format(project_id),
    auth = catmaid_API_token_auth(token),
    data = {'skeleton_ids': skeleton_ids}).json()
annotation_index = annotation_response['annotations']
skeleton_annotation_index = annotation_response['skeletons']

# Find neuron names from skeleton identifiers
name_query_data = {}
for n, skeleton_id in enumerate(skeleton_ids):
    name_query_data['skids[{}]'.format(n)] = skeleton_id
neuron_names = requests.post(
    uri + '/{}/skeleton/neuronnames'.format(project_id),
    auth = catmaid_API_token_auth(token),
    data = name_query_data).json()

# Output
for skeleton_id, annotation_list in skeleton_annotation_index.items():
    neuron_name = neuron_names[skeleton_id]
    annotation_names = [ annotation_index[str(annotation_list[i]['id'])] for i in range(len(annotation_list)) ]
    print('skeleton_id: {}; neuron_name: {}; annotations: {}'.format(
        skeleton_id, neuron_name, ', '.join(annotation_names)))
For a more thorough description of the functions available through the CATMAID API, please see the CATMAID API documentation.
Additional help
Pressing the ‘F1’ key will bring up a CATMAID help window pane that reveals commands available with any given tool. Note that some CATMAID tools will not function properly without additional access. For example, annotating additional features is not currently publicly available. However, we are happy to provide access for those who wish to create additional annotations.
Last updated on 2017-09-23 by David Hildebrand